1. Introduction
The Nectar Remote Intelligence Gateway (RIG) is a client-site monitoring and reporting appliance, which is part of Nectar Foundation APM.
The RIG is a device that is deployed at the client premise and serves multiple roles:
- Interrogation engine interacting with equipment at the client-premise targeted for management
- Local (client-premise resident) repository for event data, performance feeds, and Business Intelligence Monitors
- Aggregation point for disparate alarming sources into a common event structure
- End-client dashboard host where business level management views can be pushed to the client for client-premise/network-based access
- RIGs can also host engineering tools and be remotely accessed to allow responders a launch point from within the client’s premise, ensuring smooth and accurate use of responder tools.
- Optional Enterprise Intelligence Platform (EIP) registration for consolidated single sign-on, global views for multi-RIG deployments. For more information, see the EIP Administration Guide.
- Optional Central Intelligence Platform (CIP) registration of the client premise or client network to an external service provider where the Nectar Foundation APM is being used to facilitate third-party service provider support and remote access. For more information, see the CIP Administration Guide.
This section provides the following information:
- About this Guide
- Audience
- Supported Software Versions
- Technical Notes
- General Data Protection Regulation
- Technical Support
- Product Documentation
- RIG Specification
- Network Ports
- RIG Maintenance
1.1 About this Guide
This guide provides instructions on software administration, configuration, and concepts relating to Nectar Foundation APM, including using the Nectar RIG Client, administering security for groups and users, organizing system access and permissions, configuring network monitors, managing dependency trees, and much more.
1.2 Audience
This guide is intended for system administrators or engineers who have a background or knowledge in the delivery of managed services, infrastructure management and monitoring, and/or Unified Communications (UC) with system administration access and a broad working knowledge of Nectar Foundation APM.
1.3 Supported Software Versions
- Nectar Foundation APM v8.7
1.4 Technical Notes
Important: After upgrading to v8.7, if you have or plan to manipulate a properties file that uses a file path or directory, then you must verify that you are using the proper backslash (\) or forward slash (/):
- Windows:
Use double backslash (\\), for example, <drive>:\\<folder>\\<folder|file> or Use single forward slash (/), for example, <drive>:/<folder>/<folder|file>
- Linux/iOS:
Use single forward slash (/), for example, /<folder>/<folder|file>
1.5 General Data Protection Regulation
You must upgrade to ‘Release 7.2 or later’ to enable the new General Data Protection Regulation (GDPR) audit logging. Logging is enabled by default but can be customized to suit your specific auditing needs. The Apps\<partner name>\etc\log4j2.xml file is used to enable that customization after the upgrade to ‘Release 7.2 or later’.
The upgrade to ‘Release 7.2 or later’ will back up your existing log4j2.xml file before installing the new version of that file.
If you have previously customized the log4j2.xml file, you will have to manually migrate those changes to the new log4j2.xml file. Your previous version can be accessed by navigating to Apps\<partner name>\rollback\etc\log4j2.xml AFTER you have upgraded.
1.6 Technical Support
For technical support, contact Nectar in one of the following ways:
- Nectar technical support email address: support@nectarcorp.com
- Visit http://www.nectarcorp.com for additional information. Use your company’s login information to access the documentation.
1.7 Product Documentation
-
For additional information, see:
CIP/EIP Administration Guide
Installation Guide
Perspective Administration and User Guide
External Authentication Administration Guide
-
These documents can be found on the Partner Hive:
https://nectar.seismic.com/directlogon.aspx
-
To provide feedback on Nectar documentation:
documentation@nectarcorp.com
1.8 RIG Specification
For more information, see Nectar Appliance Guide.
1.9 Network Ports
The following is a list of network ports related to RIG communications and/or Perspective:
| Protocol | Port(s) |
|---|---|
| RIG | TCP:443/80 UDP:69 |
| NTP Server • Perspective Agent(s) > Internet |
UDP:123 |
| SMTP Server | TCP:25 |
| Active Directory / LDAP | TCP:389/636 |
| DNS Client Resolution | UDP:53 |
| Perspective Synthetic Traffic • Perspective Agent < > Perspective Agent |
• UDP:6000-7000 • Defaults, configurable |
| Nectar Registration • Perspective Agent > Perspective Controller |
• TCP:443 • UDP:5005 • Defaults, configurable |
| Nectar Client • User Desktop > Perspective Controller |
• TCP:443 • UDP:80 |
| SSH • Perspective Controller > Perspective Agent |
TCP:22 |
| Nectar Registration Controller POV • Inbound Perspective Agent > Perspective Controller |
• TCP:443 • UDP:5005 |
Table 1-1 Network Ports
1.10 RIG Maintenance
Use the following best practices to maintain RIG health:
-
Perform a 60-90 day reboot cycle.
-
Backup RIGs regularly.
-
Apply Windows Security updates manually when released by Microsoft.
-
Keep Nectar RIG software up to date (coordinated by or through the Partner, if applicable).
RIGs should be installed with the latest software release or a release that is no more than one major release behind the current GA release. Patch releases should be reviewed to determine if any issues are needed on the current software platform.
-
Schedule monthly reports for disk and CPU utilization via the Nectar RIG.
By default, data is maintained for a month. However, reports should be retained for 12 months to provide a tracking of increased usage.
Note: The system will send an alert, if the CPU or disk utilization goes above 90 percent. These alerts should be addressed when they are received. Contact Nectar Support, if the CPU utilization remains above 90 percent.
- Ensure Nectar RIG is kept up to date with any infrastructure changes, such as IP addresses, new hardware, etc.
2. Definitions
-
Central Intelligence Platform: The CIP is a server cluster provided by Nectar in a hosted data center facility that is dedicated to a business partner or service integrator. The CIP houses registration and communication proxy systems that allow service provider responders to receive alarms, securely connect to end-client deployed premise equipment (RIGs) for passing commands, and subscribe to information channels between the service provider responder and that location. For large enterprise deployments, Nectar Foundation can also provide a hierarchical system comprised of multiple EIPs.
-
Client Application: The Client Application (CA) component allows for full use of bi-directional SRSTP control. Application extensions are allowed to initiate new information channel subscriptions that are ready for broadcast from RIGs or Distributed Agents (DAs). CA also allows for the switching of registration between multiple sources, such as a CIP, a deployed client RIG, and/or a DA. The CA is dynamically loaded to a user’s system via a standard web browser that facilitates loading and communicating CA on the user’s system. CA is a graphical interface that connects to multiple Nectar systems, including but not limited to CIP, EIP, RIG, and DA, which are included in the applicable core platform product.
-
Client Portal: Different from the CA, the Client Portal (CP) (dashboard) is used to only push views. CPs are typically deployed to allow clients visibility to key metrics of the infrastructure being managed. For example, bandwidth utilization on key network connectivity points, concurrent call server registrations, digital signal processing utilization, and element host health statistics (memory, CPU, disk, network interfaces, etc.). CPs are customizable to fit the needs of the client and deployment, ensuring usefulness and securing vital desktop real estate with the client's management staff, further promoting the value of the overall solution. CP can be launched from CIP, EIP, and RIG, which are included in the applicable core platform product.
-
Dependency Tree System: Nectar Foundation APM has the ability to identify the relationships of disparate silos of technology, events, and data. Dependency trees are the underlying system that enables such correlation within the platform. These trees can be automatically generated by a specific VKM or knowledge script and adjusted to fit the actual deployment environment, or manually created to illustrate in real-time the complex relationships between different and dependent technologies.
-
Enterprise Intelligence Platform: The EIP is a system module that is typically deployed on a separate server with the option of an HA cluster. The EIP contains registration and communication proxy systems. It provides users with a centralized, consolidated, global single sign-on view for environments that have multiple RIG deployments or must run the Nectar Intelli-Q module.
The EIP enables global dashboards, which act as a launch point or provide a consolidated view of customer dashboards from multiple downstream RIGS. The dashboards also provide centralized alarming of all RIGs.
Users/responders can also use the EIP to:
-
Securely connect to downstream RIGs
-
Pass commands
-
Subscribe to information channels between user/responder and the equipment to which a RIG is providing proxy access
For large enterprise deployments, Nectar Foundation APM can provide a similar hierarchical system that enables EIP to connect to an external CIP. This is typically housed in a service provider network.
-
-
Maps: Maps provide a unique mapping function of the Nectar MSP that allows for live, alert driven visual notifications. iMaps can contain performance feeds, business process status, events, and topology shift notifications. Feature is included in the applicable core platform product.
-
Perspective Agents: Perspective agents (PAs) are restricted agents used to conduct synthetic transactions with other PAs and DAs enabled with Nectar’s Perspective feature and distributed network sniffer applications. PAs are deployed either as Master Perspective Agents or Distributed Perspective Agents and automatically register back to the Perspective Controller. PAs are often distributed throughout building and data center network infrastructure layers, Lync Front End and Edge Server locations and other distributed architectural points to create hub and spoke, and mesh synthetic traffic generation measurements.
-
Perspective Controller: Perspective is a synthetic traffic generation solution designed to simulate voice traffic patterns consistent with several codecs including but not limited to G711, G729, and G722. Perspective delivers an advantage in network pre-assessments, voice quality troubleshooting and proactive problem identification through its unique capability in generating RTP and UDP traffic. RTP and UDP traffic patterns can include a single source to multiple destinations, multiple sources to multiple destinations and/or a full mesh of traffic. Unlike many traditional synthetic engines, Perspective truly simulates a voice experience, which is customizable and able to detect degradation stemming from Route Trip Delay (RTD), Jitter, Packet Loss, and its effects on MOS (Mean Opinion Score). Additional features include end-to-end DSCP marking validation and path change notification. The Perspective Controller is installed/enabled on a RIG and the central console for management, configuration and ennoblement of Perspective Agents.
-
Remote Intelligence Gateway: The Nectar RIG is a client-site monitoring and reporting appliance, which is part of the Nectar Foundation APM. The RIG is a device that is deployed at the client premise and serves multiple roles:
- Interrogation engine interacting with equipment at the client-premise targeted for management
- Local (client-premise resident) repository for event data, performance feeds, and Business Intelligence Monitors
- Aggregation point for disparate alarming sources into a common event structure
- End-client dashboard host where business level management views can be pushed to the client for client-premise/network-based access
- RIGs can also host engineering tools and be remotely accessed to allow responders a launch point from within the client’s premise, ensuring smooth and accurate use of responder tools.
- Optional: EIP registration for consolidated single sign-on, global views for multi-RIG deployments
- Optional: CIP registration of the client premise or client network to an external service provider where Nectar Foundation APM is being used to facilitate third-party service provider support and remote access
-
Secure Remote Session Transport Protocol: The Secure Remote Session Transport Protocol (SRSTP) is a hybrid communications protocol consisting of an information bus and proprietary transport protocol. SRSTP allows for secure registration of platform components between and amongst themselves and the passing of commands and data where allowed or authorized. The communications bus is designed in a publish and subscribe manner similar to electronic trading platforms found in modern financial markets. SRSTP allows for many client-bound sessions to simultaneously exist, promoting collaboration capabilities from responders to co- resolution or training purposes.
RIGs deployed in the customer premise connect to the CIP/EIP using SRSTP tunnels. In a standard deployment, the RIGs connect directly to the CIP/EIP. This connection can be routed through a SOCKS proxy when required.
-
Vendor Knowledge Modules: The Vendor Knowledge Module (VKM) provides in-depth monitoring and management of UC infrastructure, applications, quality and services inclusive of broad, deep, dynamic polling and reporting functionality, with increased automated process capabilities. Key features include auto discovery, auto dependency tree generation, inventory, reporting, predefined dashboards or dashboard components for visualization, and leverage interrogation mechanisms for performance and health.
To visually depict these co-dependent components, the VKM creates dynamic dependency trees, eliminating the guesswork and delays in root-cause analysis while providing business- level reporting and deeper perspective of trending and analysis.
3. Nectar RIG Client Overview
The Nectar RIG Client is a Java application that is delivered through WebStart technology. To use the client on a machine, make sure that Oracle Java is integrated with your web browser.
Note: You can test your browser for Java support or download a run-time copy of Java for your machine by visiting Oracle’s Java website:
https://java.com/en/ Follow the directions to install the Java environment in your web browser.
This section provides information about the following:
- Launch and Log In Using the Nectar Client
- Summary View
- Command Buttons
- Menu Bar
- Status Bar
- Status Summary
- System Tray Icon
3.1 Launch and Log In Using the Nectar Client
Follow these steps to launch and log in using the Nectar client:
-
To launch and log in using the Nectar Client to the CIP or EIP, open your Java-enabled browser and enter the URL provided by the Nectar Administrator:
http://[your_company_name]-cip1.nectarvoip.com
-
To launch and log in using the Nectar client, a RIG only implementation, open your Java- enabled browser and enter the URL provided by the Nectar Administrator:
http://[RIG Host name or IP Address]
Java uses the link to download a description file; then downloads the support files that comprise the client application. The files are cached on the local computer, so subsequent application launches take less time.
Note: You may start subsequent client application launches directly from your local computer using the Java WebStart Viewer application. However, if you launch your client application session from the URL, you automatically receive new updates to the client application.
The Nectar Portal Login window appears:
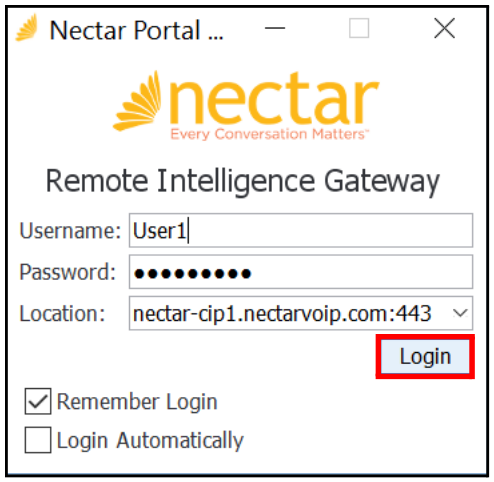
Figure 3-1 Nectar Portal Login
- Enter your Username and Password.
- Click the drop-down arrow and select a location server.
Note: Use the Location field to connect to different servers/systems. However, the Location is automatically set to the correct location server, if you launch from a URL.
- From the Nectar Portal Login window, select one of the following check boxes, as needed:
-
Click Remember Login, if you want the Nectar client to remember your Username and Password.
Next time you log in, your Username and Password will automatically appear in the designated fields.
-
Click Login Automatically, If you want to log in automatically (and skip the Nectar Portal Login window).
-
- Click Login.
- In the Location panel to the left, locate and select your RIG.
Note: If you have more than one RIG installed, click that RIG in the left Location panel in order to view the Summary window.
The Summary window appears (see Summary View).
3.1.1 Windows Integrated Authentication
The following requirements enable Windows integrated authentication on the client side:
-
Set enable.integrated.winauth = true in the application.properties file, which is located in the apps/nectar/ folder.
-
AD/LDAP authentication store should be enabled for RIGs and CIP.
For more information on authentication, see Manage Authentication.
-
The currently logged-in Windows user should be in the same AD Domain as the RIG/CIP, depending on where you want to log in.
To enable Windows integrated authentication on the RIG, see Enable Windows Integrated Authentication for RIG to CIP Connectivity.
-
Computers that launch Nectar Foundation clients and the servers running RIGs and CIPs should be on the same AD domain.
The Nectar Foundation client should automatically login without presenting the Nectar Portal Login window (which asks for your credentials) using your currently logged-in Windows user account credentials.
3.2 Summary View
After logging on, locate and select your RIG in the Location panel to the left.
The Summary window appears and posts all events generated from monitored poll functions.
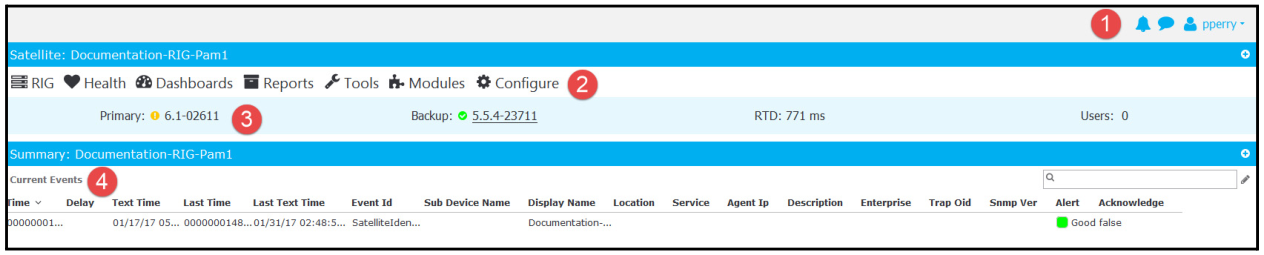
Figure 3-2 Summary Window
| Number | Name |
|---|---|
| 1 | Command Buttons |
| 2 | Menu Bar |
| 3 | Status Bar |
| 4 | Current Events For more information, see Manage Events. |
Table 3-1 View Options
When registering to a RIG, the registration process immediately displays the Summary window. This list-based view provides you with a quick glance (in text mode) of the dependency trees, events or aggregate alarms of the RIG system. Enter information, such as date, time, and event ID, to filter for specific occurrences.
The Summary view can be used to translate critical system states and business processes, and the current status of the same to the service provider. Each of these can be used in managing service levels for the end-client.
Right-click on an event to view the following options:
| Option | Description |
|---|---|
| Show Dependency Tree | Select to view the associated dependency tree, if available. |
| Event Details | Opens the View Event window to view details about the event. |
| Clear CIP Alarm | Permanently removes the instance of the selected event. The dependency tree remains in tact. |
| Copy to Clipboard | Copy the event and its information to a clipboard for later use. |
Table 3-2 Event Options
Each event is highlighted in a color from the alarm key referenced in Status Summary. Use this key to identify the alarm criticality.
3.3 Command Buttons
The command buttons are located in top-right corner of any view window. These buttons allow you to perform functions, such chatting with other users, changing passwords, and setting screen preferences.
| Item | Click to ... |
|---|---|
 |
View the Intelli-Q dashboard, which provides a live list of all events/alarms. Note: Intelli-Q is only available, if the user is logged into a CIP/EIP. If the user is directly logged into a singular RIG, they will not see any Intelli-Q information. Each alarm/issue is color-coded based on the device alert levels and prioritized based on the client service windows. |
 |
• Open the Nectar Chat window to use the Nectar chat system. • Double-click an ID to start a chat. • For more information, see Access the Chat System. |
 |
Click on the logged-in user name to open the drop-down menu. Note: Provides user login information. |
 |
Select one the following user options: • About - Provides version information about the current RIG on which you are logged in. • Change Password - Allows you to change your password on this RIG. • Settings - Allows you to: - Manage the appearance of your RIG. For example, you can use a larger banner, select the color theme for your RIG, use server nicknames (to shorten server names) in the interface, and include child nodes in the Location tree filter match. - Manage the screen appearance of your RIG by saving your settings on or loading settings from your computer. You can also choose to launch RDP Windows in full-screen mode. - Manage system settings, such as enabling debug logging for your RIG, viewing client connection details in your RIG, and refreshing permissions. - Reset settings to their original default settings. - Create a download location where data downloaded from your RIG(s) will be downloaded. • Logout - Allows you to logout of this RIG. • Exit - Allows you exit this RIG without logging out. Nectar recommends that you log out first. |
Table 3-3 User Options
3.4 Menu Bar
This menu allows you to navigate to the various functions within the RIG.

Figure 3-3 Menu Bar
To use the menu navigation bar, click on one of the following menu options:
- RIG
- Health
- Dashboards
- Reports
- Tools
- Modules
- Configure
These menu items are discussed throughout this guide.
3.5 Status Bar
The status bar provides the following RIG/CIP/EIP information, depending on what you selected in the Location pane:

Figure 3-4 Status Bar
- Primary: Primary RIG/CIP/EIP version, depending on what you selected in the Location pane; also shows if the RIG/CIP/EIP is Online or Offline. A green status icon indicates that the primary server is up and running correctly.
- Backup: Backup RIG/CIP/EIP version, depending on what you selected in the Location pane; also shows if the RIG/CIP/EIP is Online or Offline.
Note: A green status icon indicates that the RIG/CIP/EIP is functioning properly. A yellow status icon indicates that the server is unlicensed or incorrectly configured. Hovering over the status icon provides more information as to what the problem is. For example, this status shows that the CAM module did not start:
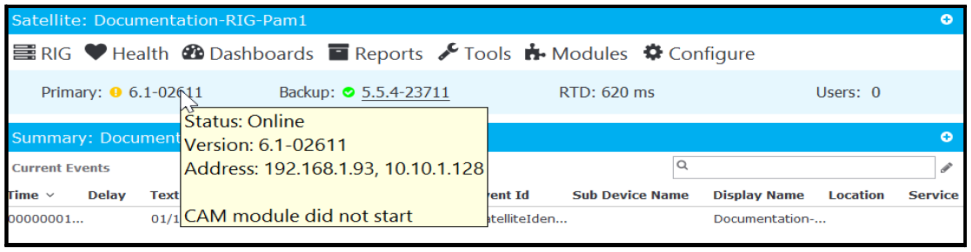
Figure 3-5 Status Bar
- RTD: Round Trip Delay is a measure of time that it takes for the RIG/CIP/EIP to communicate and get information from the box that is being monitored.
- Users: Number of users assigned to this RIG/CIP/EIP.
3.6 Status Summary
The Status Summary panel in the bottom-left corner of your window provides a list of the alerts used in the following Nectar Foundation APM functionality areas:
- Dependency Trees
- Real-Time Quality (QoS)
- Perspective Real-Time QoS
- Element Registry
- Summary
- Events
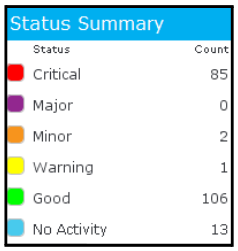
Figure 3-6 Status Summary
3.7 System Tray Icon
When you click x to close the Nectar client window, rather than selecting Exit from the User options, the System Tray icon appears on your computer task bar.

Figure 3-7 System Tray Icon
Select one of the following:
- Click on the icon to open the Nectar client window.
- Right-click on the icon and select Restore to open/restore the Nectar client window.
- Right-click on the icon and select Exit to completely close the application.
4. License and Enable Modules
After installing the RIG client, you must license and enable your modules.
This section provides information about the following:
- Important Terms
- Apply a License
- Enable a Module
4.1 Important Terms
The following definitions are important:
- Vendor Knowledge Module (VKM): This module provides:
- In-depth monitoring and management of the UC infrastructure/application.
- Quality and services including broad, deep, dynamic polling and reporting functionality.
- Increased automated process capabilities.
- Knowledge Scripts: These are used to monitor and manage the UC infrastructure, applications, and service providers in a similar fashion as the VKM. Knowledge scripts provide the ability to:
- Use either SNMP or REST API for inventory alignment.
- Run inventory collections.
- Run alignments to add agents and pollers.
- Run setup and remove for agents and polling.
- Create traps in Receiver Module and provide post process functions.
- Poller Packs: The use of poller packs provides the ability to monitor and manage any specific manufacturer infrastructure or application through the use of logical pollers. Once created, these poller packs can be exported/imported across customer RIGs. This provides a mechanism to easily onboard additional assets from the manufacturer or application. For more information, see Import/Export Poller Packs.
4.2 Apply a License
To apply a license, follow one of these sections, depending on your setup:
- Apply a License to a Local Host RIG from a CIP/EIP
- Apply a License to a Newly Installed RIG
4.2.1 Apply a License to a Local Host RIG from a CIP/EIP
Follow these steps to apply a license to a local host RIG from a CIP/EIP:
- Access the RIG via the CIP/EIP.
- Navigate to RIG > Server License.
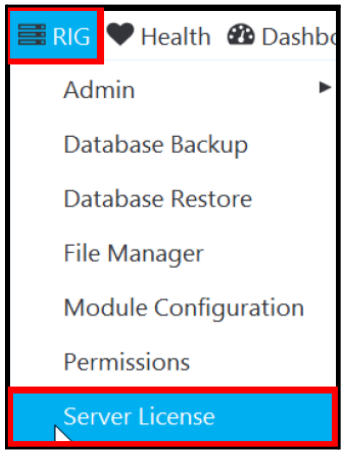
Figure 4-1 RIG > Server License
The Server License window appears.
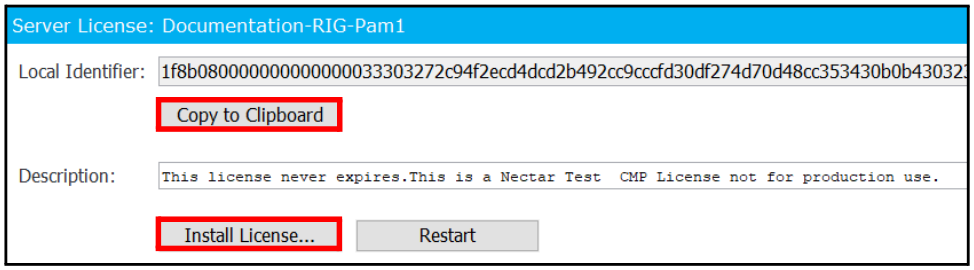
Figure 4-2 Server License
-
Click Copy to Clipboard.
-
Open a ticket with the Nectar Services Desk and attach the value copied to the clipboard.
The Service Desk provides a license file.
-
Download this license file to your desktop.
-
Click Install License.
-
Select the file received from the Nectar Services Desk.
-
To restart the RIG and apply the changes:
a. Click Restart.
b. When the following message appears, click Yes.
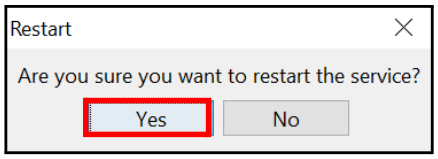
Figure 4-3 Restart
4.2.2 Apply a License to a Newly Installed RIG
Follow these steps to apply a license to a newly installed RIG (directly from the RIG):
-
Log in to the RIG via http://[RIG Host name or IP Address].
You are presented with the Server License window:
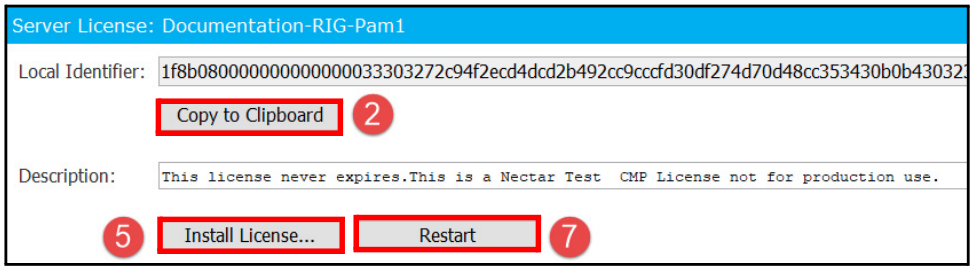
Figure 4-4 Server License
-
Click Copy to Clipboard.
-
Open a ticket with the Nectar Services Desk and attach the value copied to the clipboard.
The Service Desk provides a license file.
-
Download this license file to your desktop.
-
Click Install License.
-
Select the file received from the Nectar Services Desk.
-
To restart the RIG and apply the changes:
a. Click Restart.
b. When the following message appears, click Yes.
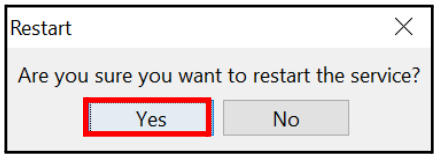
Figure 4-5 Restart
4.3 Enable a Module
After applying a module license, you must enable a module before you can use and view it in the menu:
- Log in to the RIG.
- Navigate to RIG > Module Configuration.
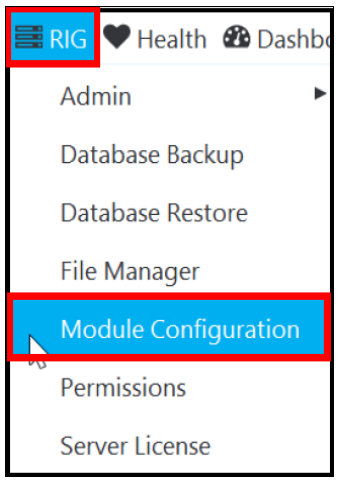
Figure 4-6 RIG > Module Configuration
- In the Module Configuration window, select the module(s) you want to enable.
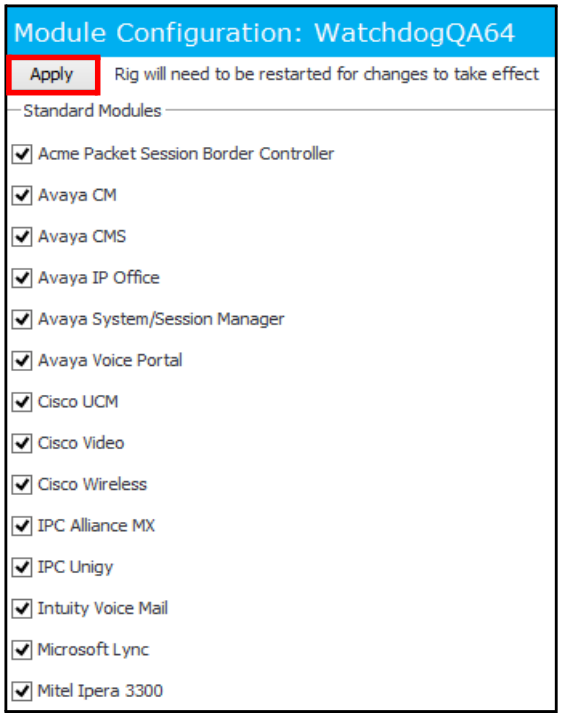
Figure 4-7 Select Module(s) to Enable on RIG
- Click Apply.
- Restart the RIG and apply the changes.
Note: To disable a module, uncheck the check box and click Apply; then restart the RIG.
- For more detailed instructions on configuring and using the various modules), see the related Configuration Guide for your installed module(s).
4.3.1 Restart the RIG
Follow these steps to restart the RIG and apply the changes:
- Navigate to RIG > Admin > Restart.
- When the following message appears, click Yes.
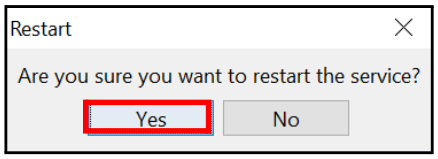
Figure 4-8 Restart
5. Security Administration
The Permission module stores login information and user permissions. It is a required module for all RIG installations. Permissions for each RIG server are managed in the Permission Manager.
This section explains how to:
- Manage Users
- Manage Groups
- Manage Authentication
- Manage Password and Session Rules
- Reset Expired Passwords
- Reset Password History
- Expire Password Now
5.1 Manage Users
This section explains how to manage RIG users, including:
- Add a User
- Enable Two-Factor Authentication
- Edit a User
- Remove a User
- Add a User to a Group
5.1.1 Add a User
Follow these steps to add a user:
- Navigate to RIG > Permissions.
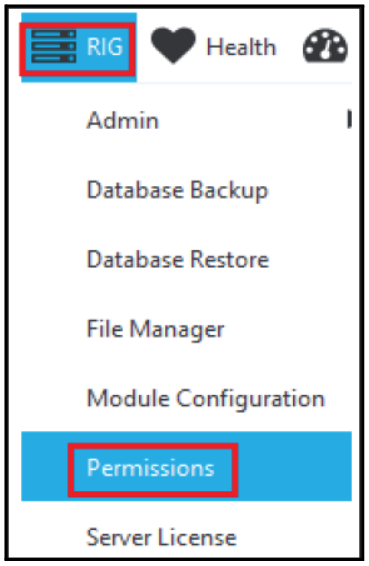
Figure 5-1 RIG > Permissions
The Permissions - Users window appears.
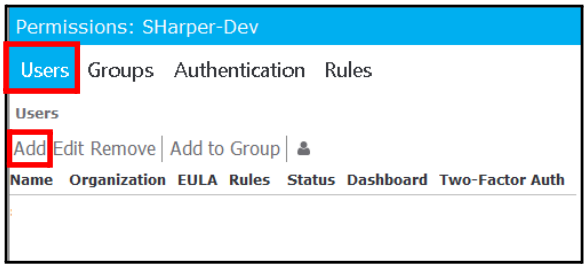
Figure 5-2 Users - Add
- Click Add.
Note: You can also right click and select Add to add a new user.
The Add User - Details window appears.
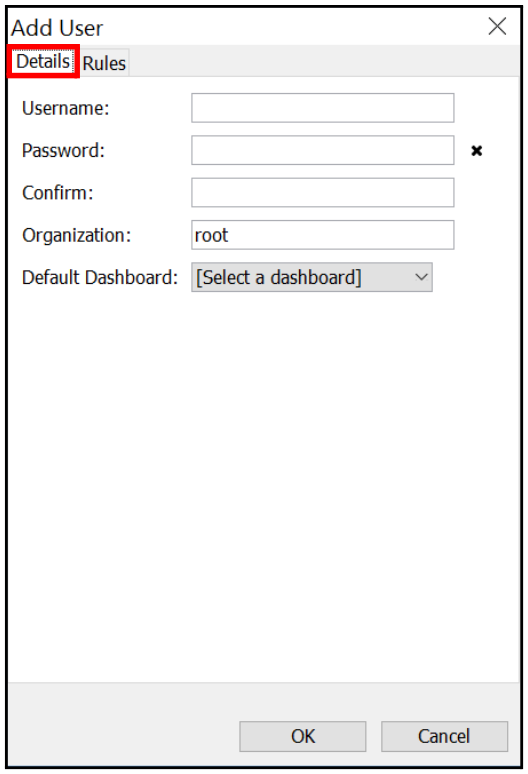
Figure 5-3 Add User
-
Enter a Username that is alphanumeric and case sensitive without a minimum or maximum value.
-
Enter the user’s password in the Password and Confirm fields.
-
In the Organization field, enter the organization to which the user is assigned (typically root).
-
From the Default Dashboard menu, select a default dashboard that will show up by default when you navigate to Dashboards > Dashboard.
-
Click the Rules tab.
The Add User - Rules window appears:
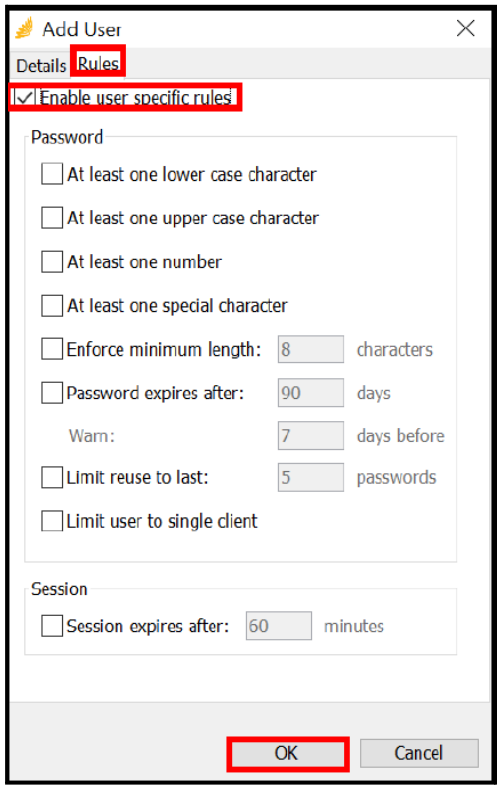
Figure 5-4 Rules
- Click the Enable user specific rules check box to activate the selected Password and Session rules, if needed.
- Select and specify a value, if activated, for the Password and Session rules for the user accessing your RIG.
- Click OK.
5.1.2 Enable Two-Factor Authentication
Two-factor authentication provides an additional layer of security.
Follow these steps to enable two-factor authentication for a specific user:
- Navigate to RIG > Permissions.
- The Permissions - Users window appears.
- Select a user; then right-click and select Enable Two-Factor Authentication.
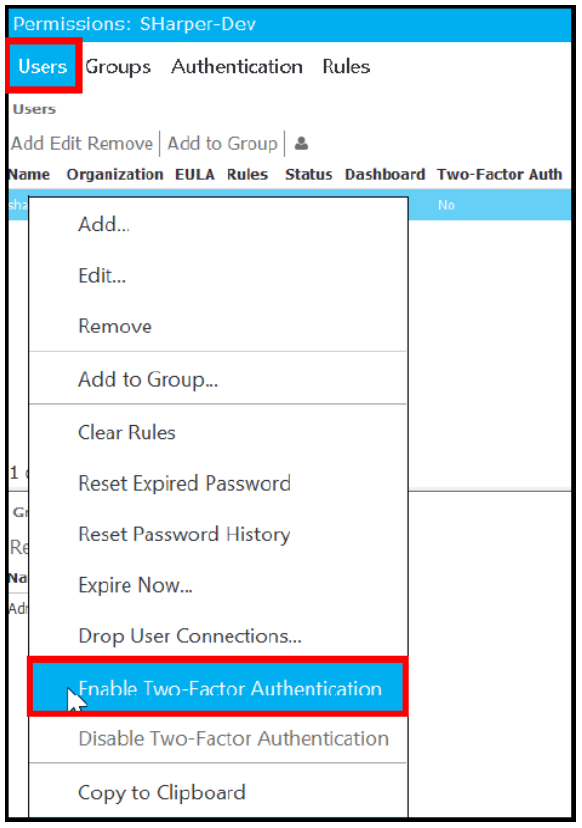
Figure 5-5 Enable Two-Factor Authentication
The Enable Two-Factor Authentication window appears.
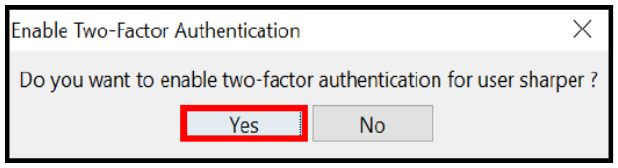
Figure 5-6 Enable Two-Factor Authentication
-
Click Yes.
The Two-Factor Auth Setup window appears.
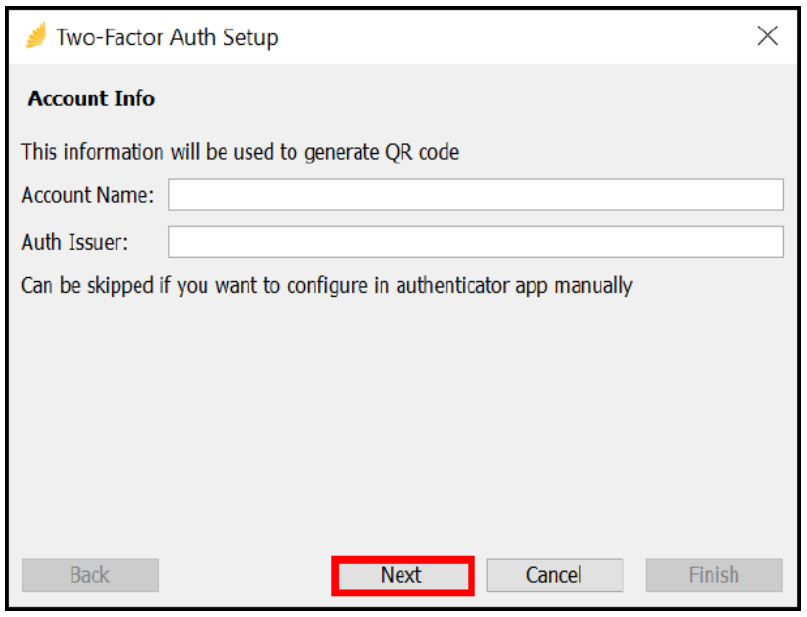
Figure 5-7 Two-Factor Auth Setup
- Enter the following information for the two-factor authentication:
| Parameter | Enter ... |
|---|---|
| Account Name | Meaningful name for the authentication. |
| Auth Issuer | Name of authorized individual issuing authentication. |
-
Click Next.
The following window appears with the new generated Secret key.
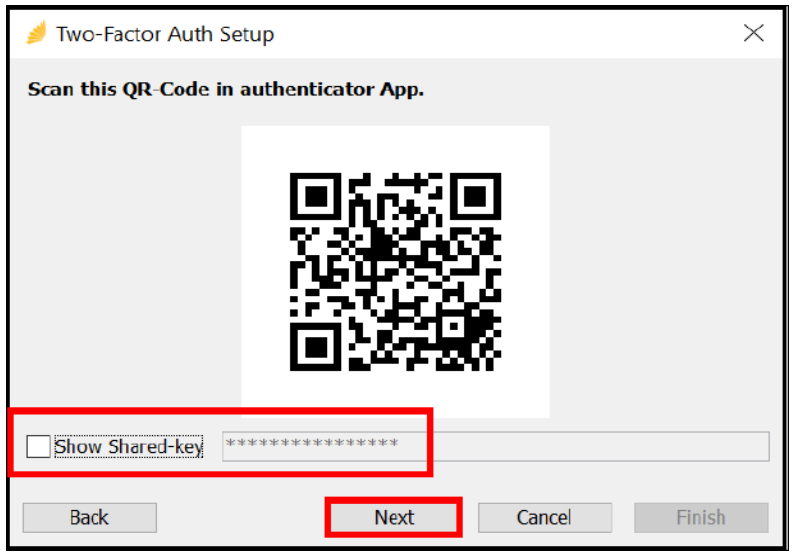
Figure 5-8 Secret Key
-
Scan the generated QR-Code using a third-party authentication application, such as Google Authenticator or WinAuth, to generate a one-time password (OTP); then click Next.
The authentication application creates an OTP that is valid for a short period of time.
Note: You can also manually enter the Shared-key in the authentication application to generate an OTP. You will need to click the Show Shared-key check box to view the key.
- When the following Confirm with OTP window appears, enter the OTP generated from the authentication application to complete the setup.
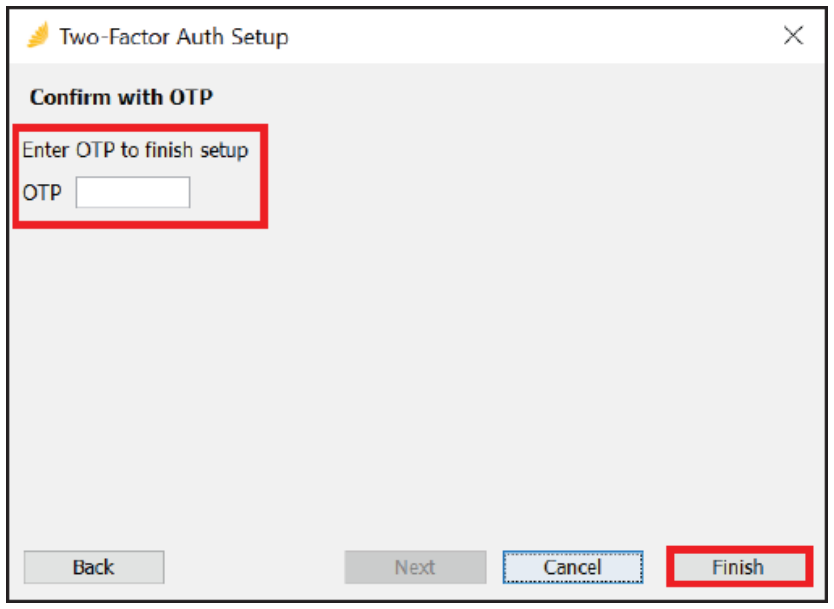
Figure 5-9 Confirm with OTP
- Click Finish.
Note: For each login, a generated OTP from the authentication application must be entered in addition to the username and password.
To disable, select a user; then right-click and select Disable Two-Factor Authentication. Click Yes to confirm.
5.1.3 Edit a User
Follow these steps to edit a user:
- Navigate to RIG > Permissions.
- The Permissions - Users window appears.
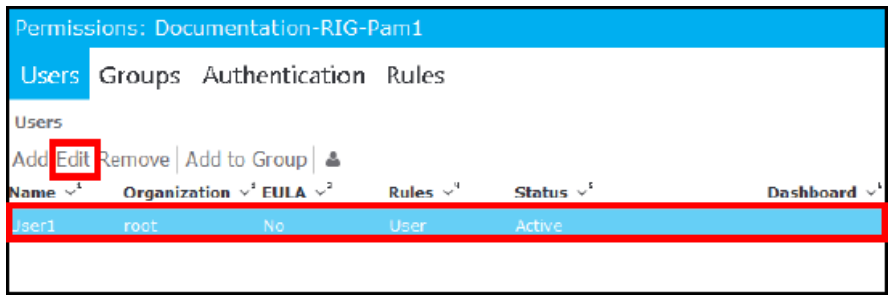
Figure 5-10 Users - Edit
-
Select a user; then select Edit.
The Edit User - Details window appears.
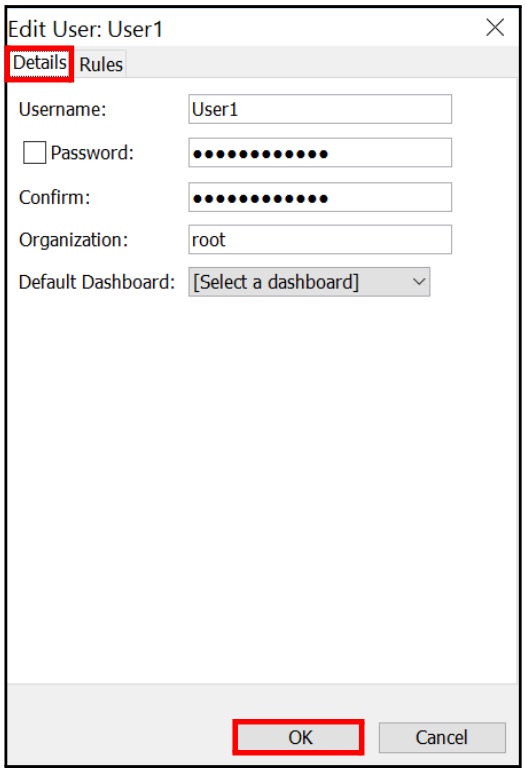
Figure 5-11 Edit User
-
Select the Password check box, if you want to change the password associated with the user.
The Password and Confirm fields are cleared, so that you can enter a new password.
-
Make changes to the following selections, as needed:
- Organization
- Default Dashboard
-
Click the Rules tab.
-
Make changes, as needed, to the Password and Session rules.
-
Click OK.
5.1.4 Remove a User
Follow these steps to remove a user:
-
Navigate to RIG > Permissions.
The Permissions - Users window appears.
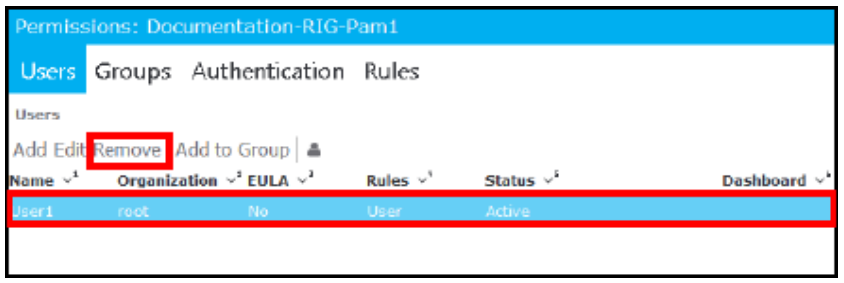
Figure 5-12 Users - Remove
-
Select a user; then click Remove.
The Remove User window appears with the following message:
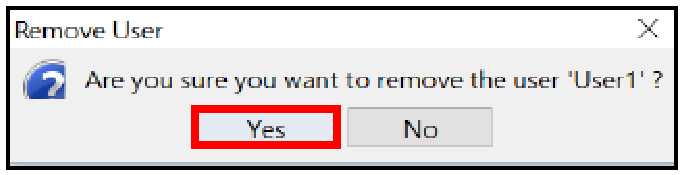
Figure 5-13 Remove User
- Click Yes.
5.1.5 Add a User to a Group
To control user access to functional areas within the system, a group with designated permissions may be assigned or removed from the user.
Follow these steps to add a user to a group:
-
Navigate to RIG > Permissions.
The Permissions - Users window appears.
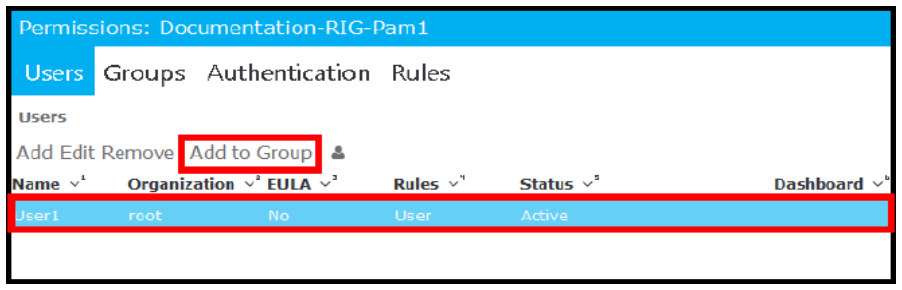
Figure 5-14 Users - Add to Group
-
Select a user; then click Add to Group.
The Add User to Group window appears.
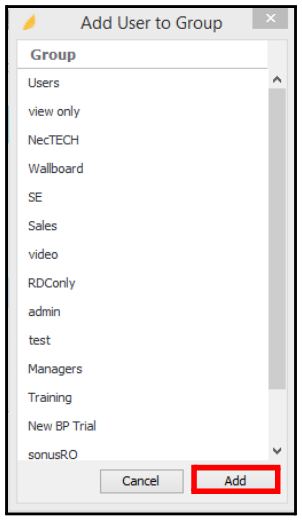
Figure 5-15 Add User to Group
- Select a group in the list; then click Add.
Note: You can select multiple groups to assign to a user:
Hold down the Shift key to highlight groups located next to each other; then click Add.
Hold down the Ctrl key to randomly select a group; then click Add.
Note: The Add User to Group window is populated with groups that you create, as discussed in Add a Group.
The user is now assigned to that group(s).
- View a selected user’s group memberships in the Group Membership pane. In this example, user User1 is assigned to Admin group.
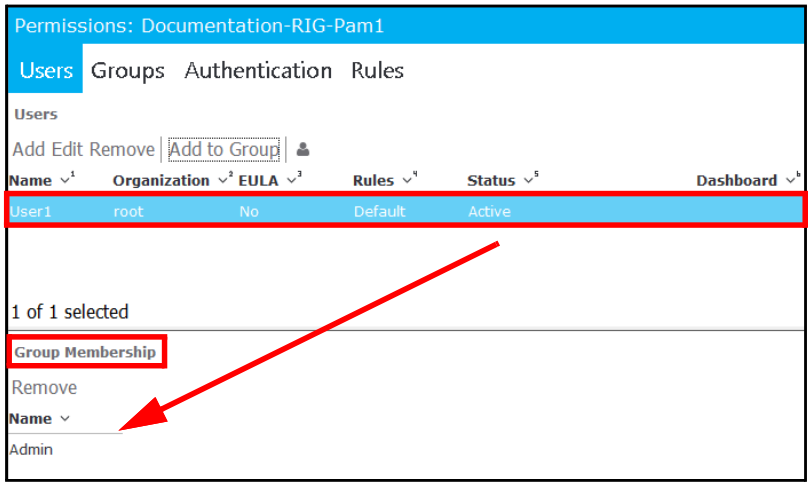
Figure 5-16 User Permissions
5.2 Manage Groups
Groups allow you to grant users specific access to system areas. The Permission Manager does not contain default user groups.
This section explains how to:
- Add a Group
- Edit a Group
- Remove a Group
- Assign Permissions to a Group
5.2.1 Add a Group
Follow these steps to add a group:
-
Navigate to RIG > Permissions.
The Permissions - Users window appears.
-
Click the Groups tab.
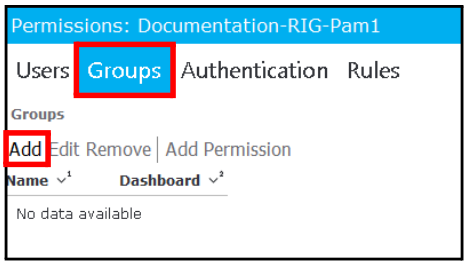
Figure 5-17 Permissions - Groups
-
Click Add.
The Add Group window appears.
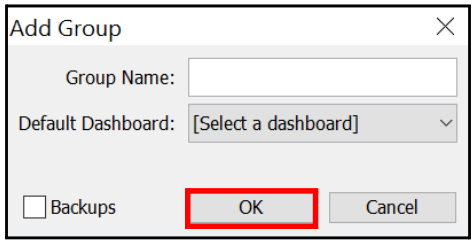
Figure 5-18 Add Group
-
Enter the name of the new group, such as Admin.
-
Click the drop-down arrow and select the Default Dashboard for this group.
-
Select Backups to add the group to the backup server instance.
-
Click OK.
The new group name and dashboard appear in the Groups pane.
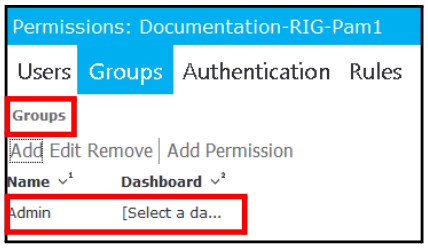
Figure 5-19 New Group
5.2.2 Edit a Group
Follow these steps to edit a group:
-
Navigate to RIG > Permissions.
The Permissions - Users window appears.
-
Click the Groups tab.
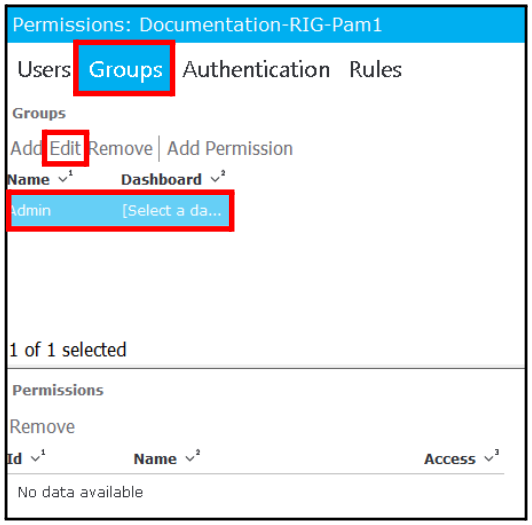
Figure 5-20 Permissions - Groups
-
Select a group; then click Edit.
The Edit Group window appears.
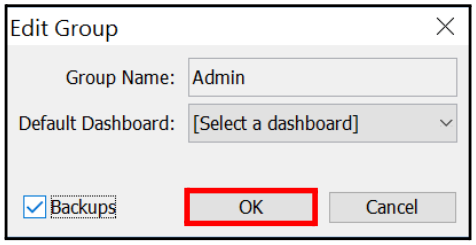
Figure 5-21 Edit Group
- Edit the Default Dashboard, as needed.
- Select Backups to add (or remove) the group to (from) the backup server instance.
- Click OK.
5.2.3 Remove a Group
Follow these steps to remove a group:
-
Navigate to RIG > Permissions.
The Permissions - Users window appears.
-
Click the Groups tab.
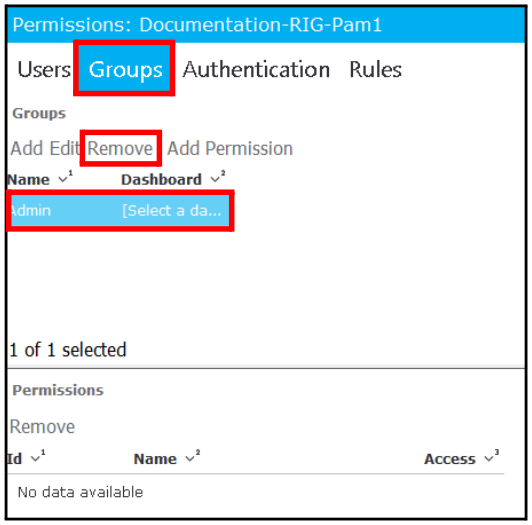
Figure 5-22 Permissions - Groups
-
Select a group; then click Remove.
The group is removed from the Groups pane without any warning.
5.2.4 Assign Permissions to a Group
Follow these steps to assign permissions to a new group:
-
Navigate to RIG > Permissions.
The Permissions - Users window appears.
-
Click the Groups tab.
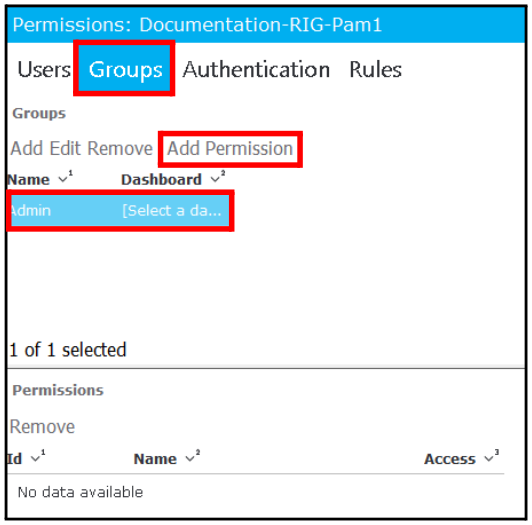
Figure 5-23 Permissions - Groups
-
Select a group; then click Add Permission.
The Add Permission to window appears.
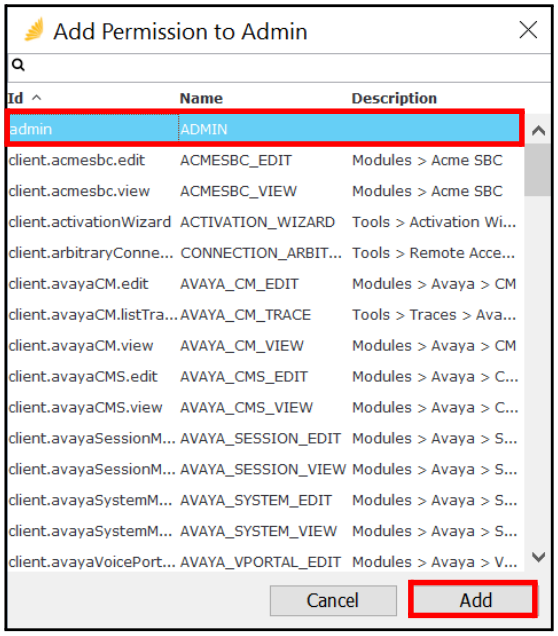
Figure 5-24 Add Permission To Group
- Select a permission; then click Add.
Note: You can select multiple permissions to assign to a group:
Hold down the Shift key to highlight permissions located next to each other; then click Add.
Hold down the Ctrl key to randomly select a permission; then click Add.
The selected permission is added to the group.
- View a selected group’s permissions in the Permissions pane. In this example, the group Admin is assigned to the Admin permission.
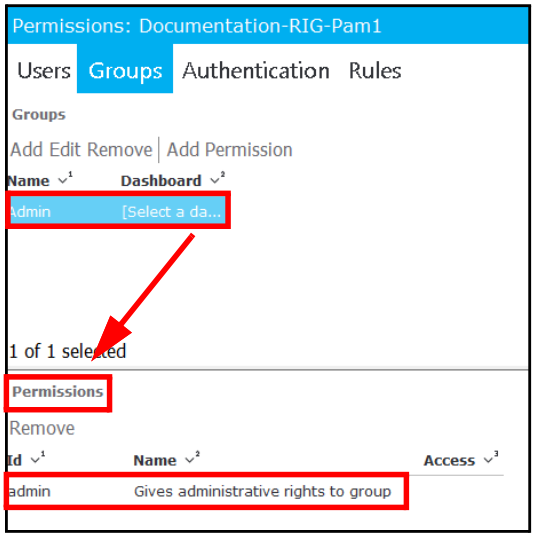
Figure 5-25 Group Permissions
5.3 Manage Authentication
Follow these steps to select an authentication type:
-
Navigate to RIG > Permissions.
The Permissions - Users window appears.
-
Click the Authentication tab.
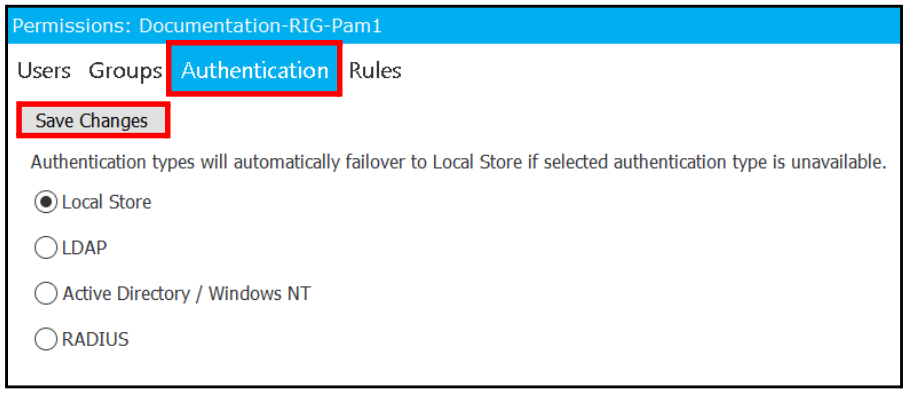
Figure 5-26 Permissions - Groups
- Select one of the available authentication types:
- Local Store
- LDAP
- Active Directory / Windows NT
- RADIUS
Note: The last three authentication types require you to enter additional authentication details. Authentication types will automatically failover to the Local Store, if the selected authentication type is unavailable.
For more information on authentication types, see External Authentication Administration Guide.
- Click Save Changes at the top of the dialog when you have made your selections and entries.
5.3.1 Enable Windows Integrated Authentication for RIG to CIP Connectivity
To enable Windows integrated authentication for RIG to CIP connectivity, make sure the following requirements are met:
- AD/LDAP authentication store should be enabled on CIP.
- Both the RIG and CIP must be on the same AD domain.
- Set the constant UUID value IWA:12622123-df90-4e6c-8493-561a24101b35 for the password property in the RIG’s infospot.properties file (located in the /etc folder).
- Set the constant UUID value IWA:12622123-df90-4e6c-8493-561a24101b35 for the superpassword property in the RIG’s server.properties file (located in the /etc folder) in order for CIP to lookup the RIG.
5.4 Manage Password and Session Rules
Follow these steps to set up password and session rules for local users/groups accessing your RIG:
-
Navigate to RIG > Permissions.
The Permissions - Users window appears.
-
Click the Rules tab.
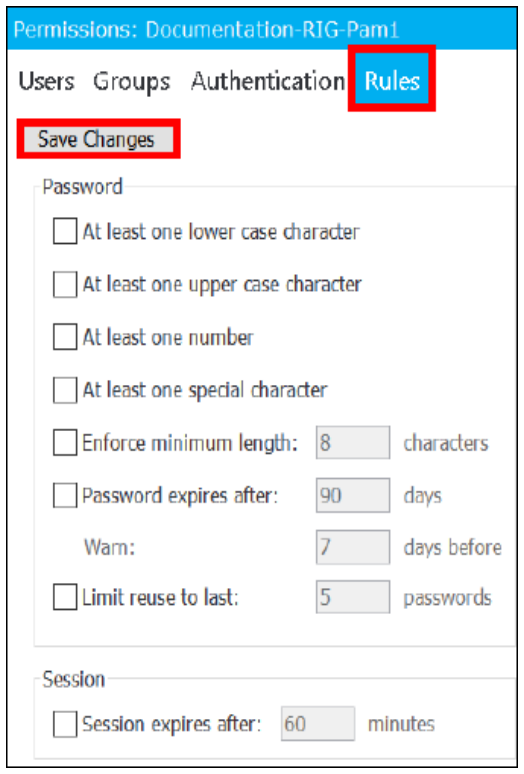
Figure 5-27 Rules
- Select any of the available password rules for local users/groups accessing your RIG.
- Click Save Changes to apply these changes.
5.5 Reset Expired Passwords
Follow these steps to reset expired account passwords:
-
Navigate to RIG > Permissions.
The Permissions - User window appears.
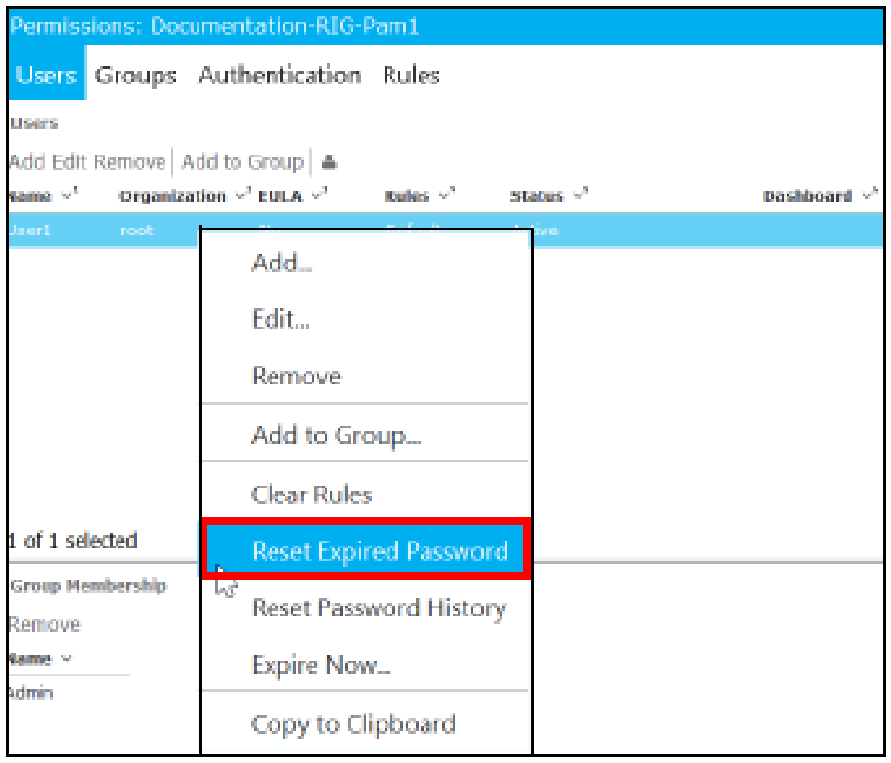
Figure 5-28 Reset Expired Password
-
Select a user whose password has expired; then right-click and select Reset Expired Password.
The Reset Expired User Password dialog box appears with the following message:
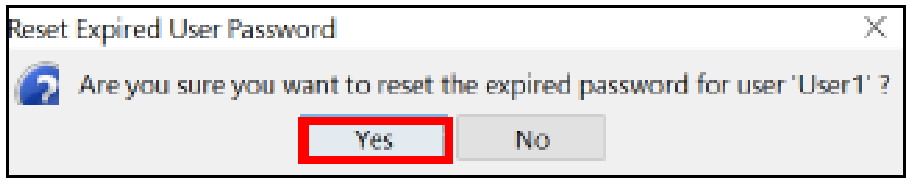
Figure 5-29 Reset Expired User Password
- Click Yes to confirm your decision to reset this user’s password. The user will receive a notification with a temporary password.
5.6 Reset Password History
Follow these steps to reset a user’s password history, so they can reuse former passwords:
-
Navigate to RIG > Permissions.
The Permissions - User window appears.
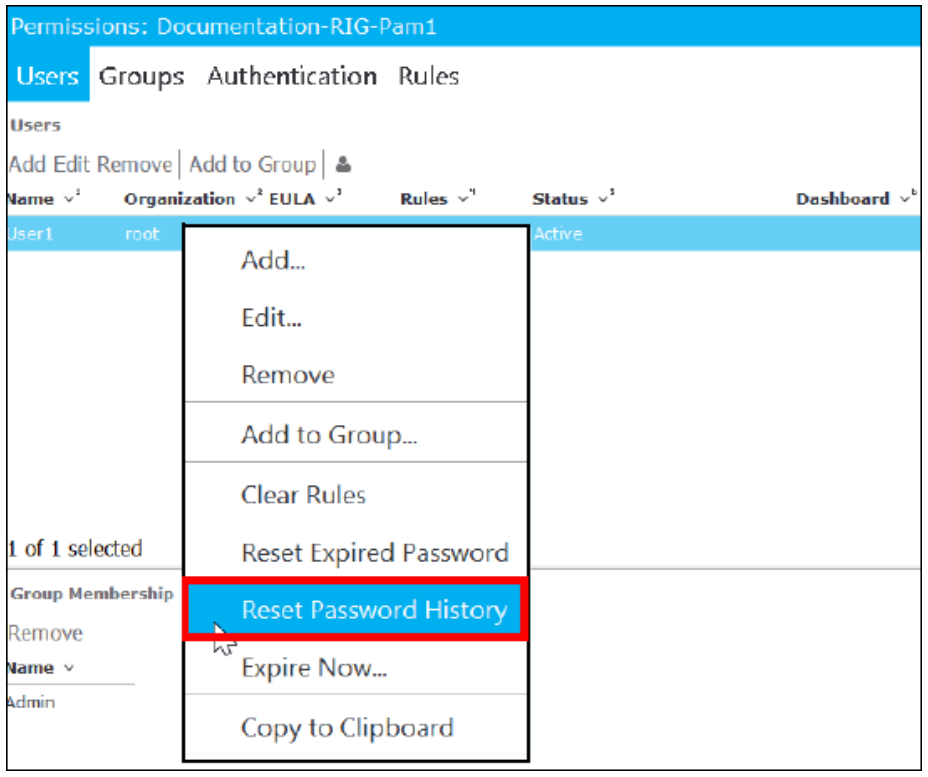
Figure 5-30 Reset Password History
-
Select a user whose password history needs to be reset; then right-click and select Reset Password History.
The Reset Password History dialog box appears with the following message:

Figure 5-31 Reset Password History
- Click Yes at the prompt to confirm your decision to reset this user’s password history.
5.7 Expire Password Now
Follow these steps to immediately expire a user’s password. This is useful when a user has left the company, and you want to prevent them from accessing the system.
-
Navigate to RIG > Permissions.
The Permissions - User window appears.
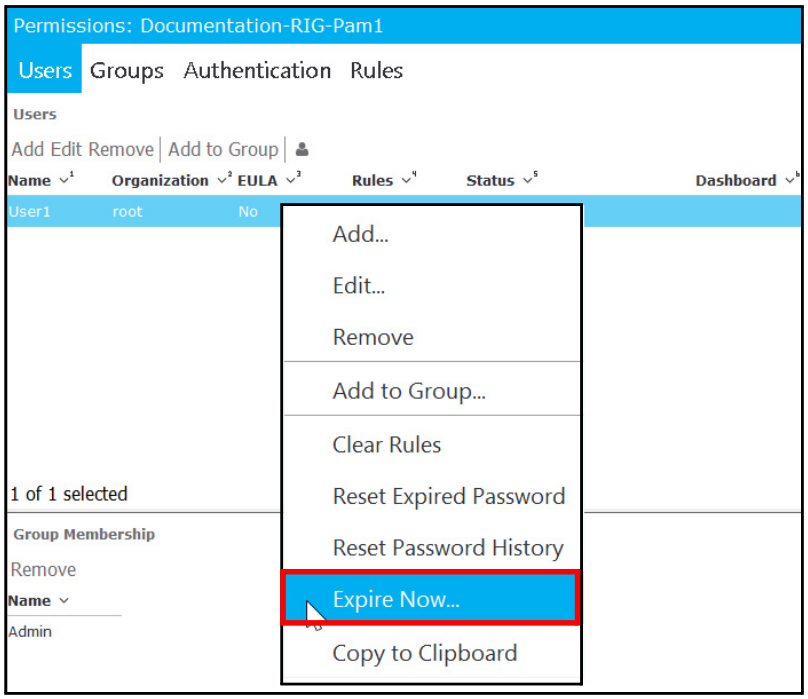
Figure 5-32 Expire Now
-
Select a user whose password needs to be removed now; then right-click and select Expire Now.
The Expire Passwords dialog box appears with the following message:
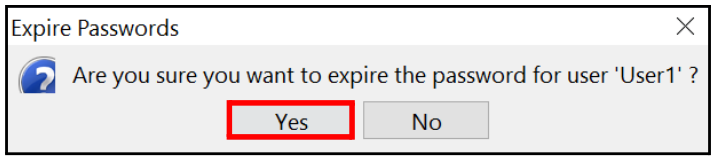
Figure 5-33 Reset Expired User Password
- Click Yes at the prompt to confirm your decision to expire this user’s password immediately.
6. Access the Chat System
The Chat icon is located in the top-right corner of the window. It allows you to access the Nectar Chat System. This is an instant messaging system that allows chat sessions among logged in users:

Figure 6-1 Chat Icon
Follow these steps to use the Chat system:
-
Select the icon at the top right area of the window.
A list of chat contacts appears in left pane. Your name is located at the top of the list:
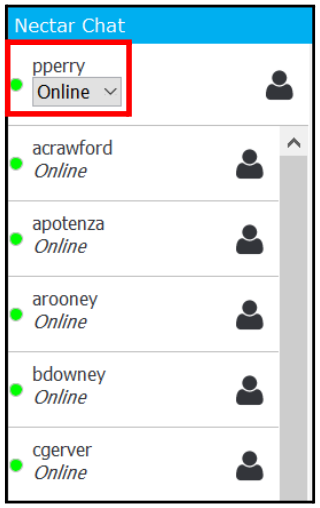
Figure 6-2 Chat Contacts
- To set your chat status, click the drop-down arrow beneath your name in the Chat pane, and select one of the following statuses:
- Online
- Away
- Busy
- Offline
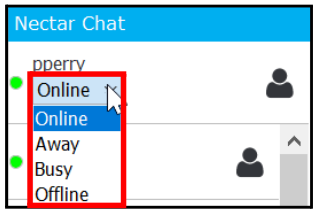
Figure 6-3 Chat Status
- To chat with someone, double-click on their user name in the Chat panel.
- Enter your message in the field at the bottom of the right pane where you see Type here and press Enter to send the message.
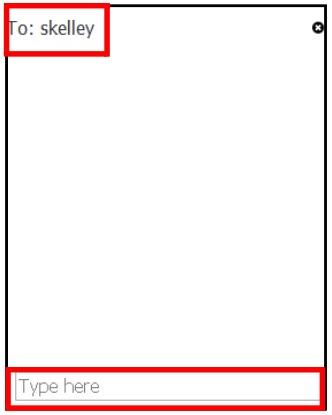
Figure 6-4 Chat Window
The message immediately appears in the top area of the pane.
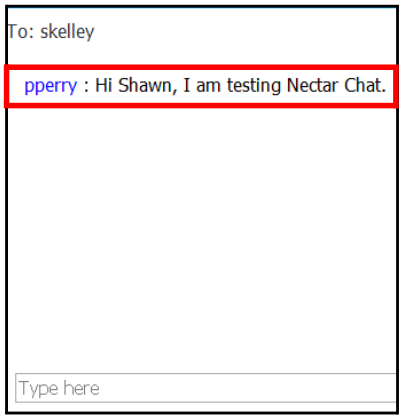
Figure 6-5 Sample Chat
Note: - The dialog between the two users is distinguished by font color: blue and red.
The history of the chat session remains in the top portion of the pane.
You can use the Chat pane to exchange data as well as conversations.
Drag and drop events into the Chat field as links that direct the other user to the event details.
7. Remote Access
Administrators can use the Connection Broker module to manage permissions and access to servers, applications, networks, and more. You can view a list of all open connections and the individuals that have open connections through a client RIG. The Socket Tunnel allows you to connect to a specific server through a connection request.
This section provides information about the following:
- Connection Broker
- Open Connections
- Socket Tunnel
7.1 Connection Broker
The Connection Broker module is used to broker connections to servers, local application connections, desktops, web interfaces, networks, and so on. It provides two advanced features to Service Provider Responders:
- The ability to use third-party applications, such as element management systems or native equipment manufacturer tools, directly from the desktop running the Client Application Portal.
- The ability to have common access tools, such as Telnet, web access, SSH, Remote Desktop and third-party tool launches, in a central list maintained by the Service Provider for repetitive and instance access.
-
To access the Connection Broker, navigate to Tools > Remote Access > Connection Broker.
The Connection Broker window appears.
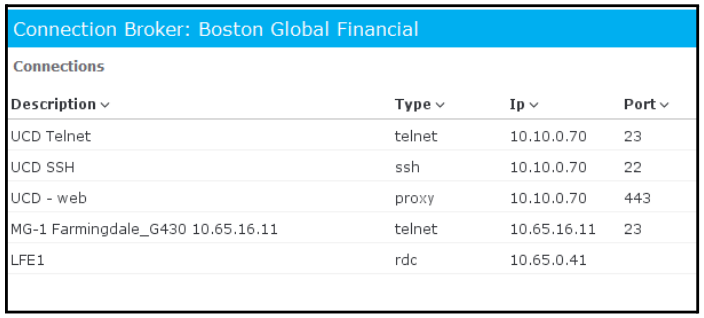
Figure 7-1 Connection Broker
- Right-click within the Connection Broker list and select from the following options:
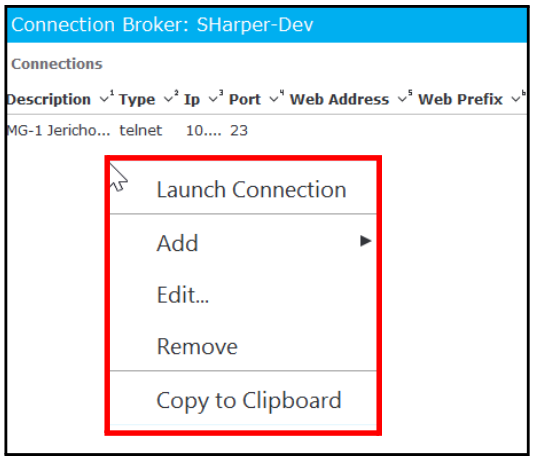
Figure 7-2 Connection Broker Menu Options
| Command | Description |
|---|---|
| Launch Connection | • Starts a connection for a specific connection type. • For this connection to be established, you must enter all values correctly using Add a Connection. |
| Add | Creates a new connection by selecting from the available options. For example, if you select Add > SSH Connection, the Add SSH Connection window appears, where you must enter connection details, so this connection type can be established. For more information, see Add a Connection. |
| Edit | Modifies details for a specific connection type. For more information, see Edit Connection Properties. |
| Remove | Permanently deletes the connection type from the list. For more information, see Remove a Connection. |
Table 7-1 Menu Options
7.1.1 Add a Connection
Follow these steps to add a connection:
-
Navigate to Tools > Remote Access > Connection Broker.
The Connection Broker window appears.
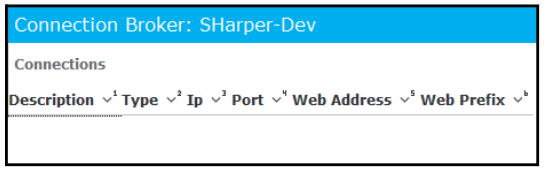
Figure 7-3 Connection Broker
- Right-click in the Connections pane and select Add; then select one of the following types to create a connection:
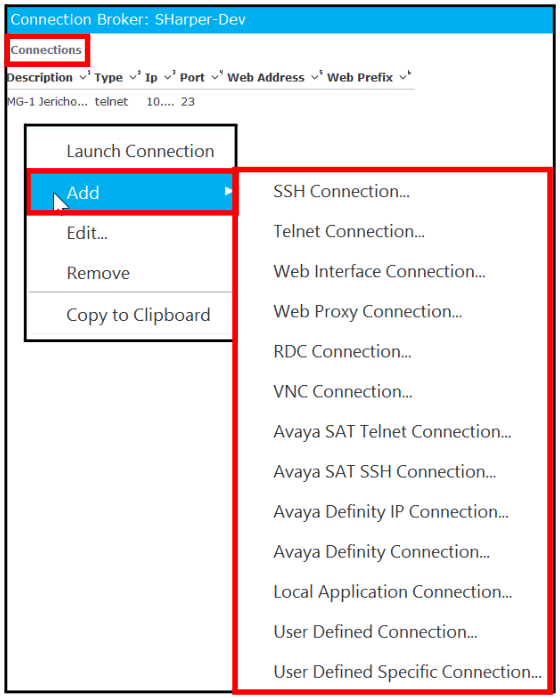
Figure 7-4 Connection Types
| Connection Type | Description |
|---|---|
| SSH Connection | • Secure Shell is a type of network protocol that uses a secure channel to exchange data between two network devices through TCP port 22. • Primarily, used for GNU/Linux- and Unix-based systems. • Enter a Description, Host, Port, Username, and Password for this connection type. |
| Telnet Connection | • Terminal Network is a type of network protocol that provides access to a command line interface on a remote host through TCP port number 23. • Enter a Description, Host, and Port for this connection type. |
| Web Interface Connection | • Connects to a web interface. • Enter Description, Host, Port, Address Prefix, and Address Postfix for this connection type. |
| Web Proxy Connection | • Connects to a web proxy. • Enter Description, Host, Port, Prefix, and Location for this connection type. |
| RDC Connection | • Remote Desktop Connection allows access to the graphical interface of another network computer running the terminal services server. • By default the server listens on TCP port 3389. • Enter Description and Host for this connection type. |
| VNC Connection | • Virtual Network Computing is a graphical desktop sharing system that uses a RFB (Remote Frame Buffer) protocol to remotely control another network computer. • Enter Description, Host, and Port for this connection type. |
| Avaya SAT Telnet Connection | • Allows you to establish an Avaya SAT Telnet connection. • Enter a Description, Host, Port, Username, and Password for this connection type. |
| Avaya SAT SSH Connection | • Allows you to establish an Avaya SAT SSH connection. • Enter a Description, Host, Port, Username, and Password for this connection type. |
| Avaya Definity IP Connection | • Allows you to establish an Avaya Definity IP connection. • Enter a Description, Host, Port, Username, and Password for this connection type. |
| Avaya Definity Connection | • Allows you to establish an Avaya Definity connection. • Enter a Description, Port, Username, and Password for this connection type. |
| Local Application Connection | • Allows you to establish a local application connection. • Enter a Description, Host, Port, Application Name, and Application Parameters for this connection type. |
| User Defined Connection | • Allows you to establish a user-defined connection. • Enter a Description, Host, and Port for this connection type. |
| User Defined Specific Connection | • Allows you to establish a specific user-defined connection. • Enter a Description, Host, Port, and Local Port for this connection type. |
Table 7-2 Connection Types
-
After you select the connection type and enter the connection data; then click Add.
The new connection appears in the Connections pane.
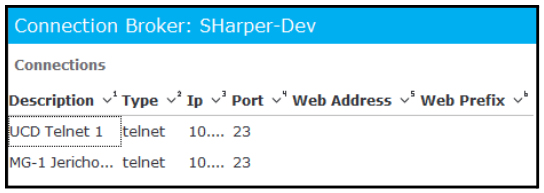
Figure 7-5 New Connection
7.1.2 Edit Connection Properties
Follow these steps to edit a connection:
-
Navigate to Tools > Remote Access > Connection Broker.
The Connection Broker window appears.
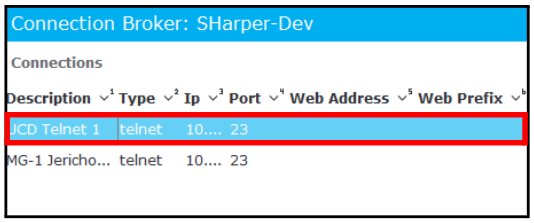
Figure 7-6 Edit a Connection
-
Select a connection; then right-click and select Edit.
The Edit Connection Properties window appears.
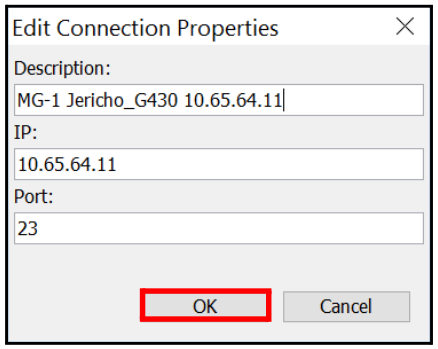
Figure 7-7 Edit Connection Properties
- Change the following values, as needed; then click OK.
-
Description
-
IP
-
Port
The updated connection appears in the Connections pane.
-
7.1.3 Remove a Connection
Follow these steps to remove a connection:
-
Navigate to Tools > Remote Access > Connection Broker.
The Connection Broker window appears.
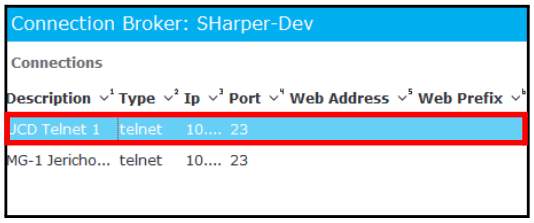
Figure 7-8 Edit a Connection
-
Select a connection; then right-click and select Remove.
The connection is removed without warning and no longer appears in the Connections pane.
7.2 Open Connections
To view a list of all open connections, as well as the individuals that currently have open connections through the specified client RIG:
-
Navigate to Tools > Remote Access > Open Connections.
The Open Connections window appears.
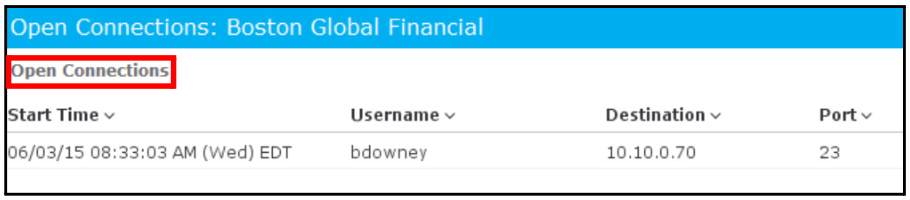
Figure 7-9 Open Connections
7.3 Socket Tunnel
You can use the Socket Tunnel to connect to a specific server through a connection request.
-
Navigate to Tools > Remote Access > Socket Tunnel.
The Start Socket dialog box appears.
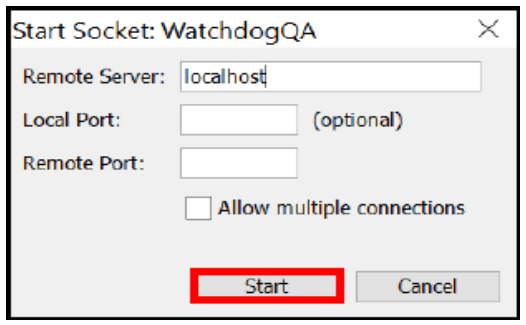
Figure 7-10 Start a Socket Tunnel
- Enter the following information to start a socket tunnel:
| Parameter | Description |
|---|---|
| Remote Server | Keep as localhost or enter the name of the remote server. |
| Local Port | (Optional) Enter the port number of your local machine, if needed. |
| Remote Port | Required to access the remote server; the socket is bound specifically to this port number. |
| Allow Multiple Connections | Check this box to allow the server to maintain your connection, while keeping another connection open to listen for additional requests. |
Table 7-3 Parameters
-
Click Start.
The Remote Sockets dialog box appears with your perpetual socket number.
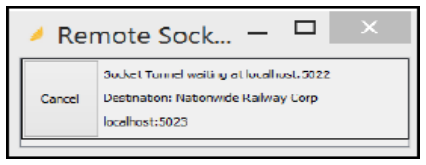
Figure 7-11 Remote Socket Number
8. File Manager
File Manager is most often used on a RIG and EIP level to complete file transfers, software upgrades, and/or release management at a client premise. File Manager is also available at the CIP level to stage upgrades for Farm and Wayside servers.
Note: Upgrades to Farm and Wayside servers are generally completed by Nectar.
This section provides the following information:
- File Manager Overview
- File Manager Features
- Move Files and Directories
8.1 File Manager Overview
To access File Manager, navigate to RIG > File Manager:
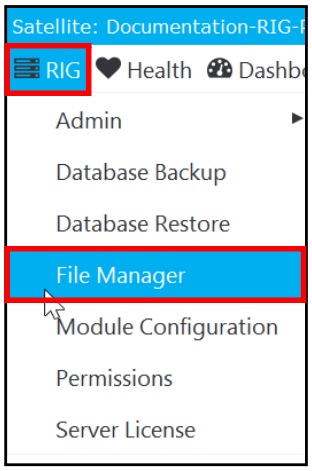
Figure 8-1 RIG > File Manager
File Manager allows you to copy files from your local host to a target RIG.
Service Providers can use it to place updated files for release management at the client premise in a service directory directly on the RIG. The RIG can later be used as an FTP, TFTP, or UNC source for locally distributing the file at the client premise or within the client WAN.
You can also use File Transfer to send ISO images to RIGs that are equipped with DVD burners. This is useful when local hands require software for servicing the client that might be missing or lost at the client premise. Note that the length of transfer will differ from client to client based on the bandwidth available to the on-premise RIG that has access to the Internet.
The File Manager provides directory access to the RIG, where you can:
- Upload files from your local file system to the RIG.
- Download files from the RIG to your local computer.
8.2 File Manager Features
This section introduces you to a few key File Manager features, including:
- Local/Remote File System
- Home Link
- File Manager Icons
- Drives
- Breadcrumb Paths
8.2.1 Local/Remote File System
File Manager contains two panes:
- Local File System - Displays your local computer’s directory structure.
- Remote File System - Displays your remote RIG’s directory structure.
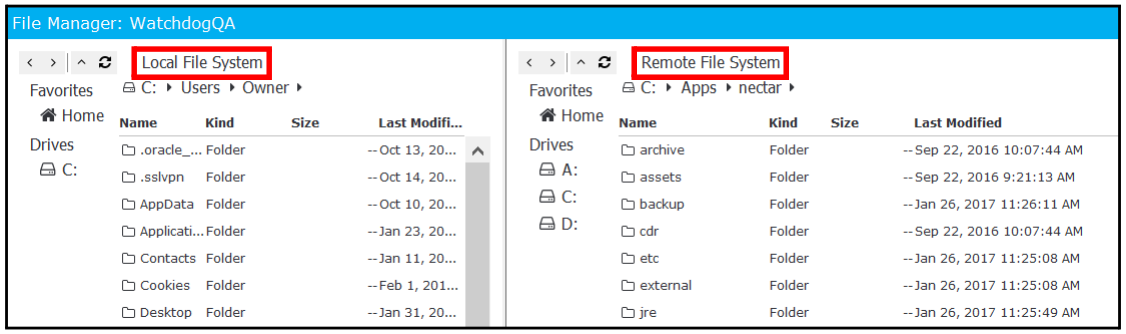
Figure 8-2 Local/Remote File System
8.2.2 Home Link
The Home link appears in the Local and Remote File System panes.
- In the Local File System pane, the Home link displays the directory structure that the client recognizes as your Users > Owner directory structure.
- In the Remote File System, the Home link displays the RIG installation directory structure.
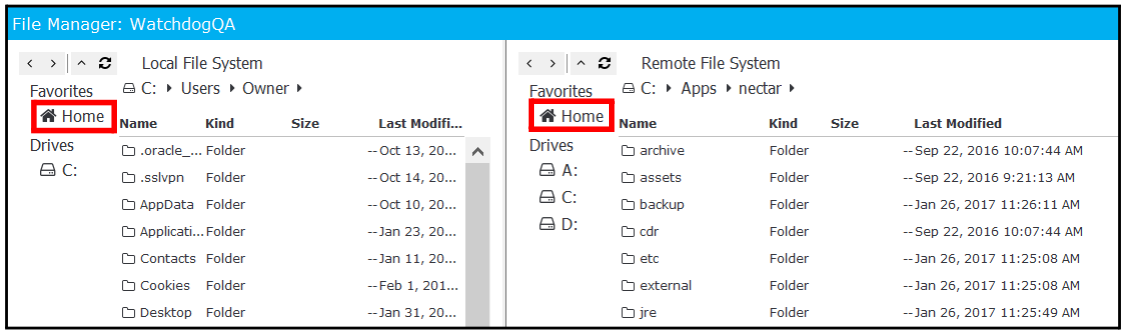
Figure 8-3 Home Link
8.2.3 File Manager Icons
File Manager contains several icons on each directory structure menu that are useful:
- The < icon allows you navigate backward through the history of where you have been in the session.
- The > icon allows you to navigate forward through the history of where you have been in the session.
- The ^ icon takes you up one level in the directory structure.
- The Refresh icon refreshes the contents in the directory structure.
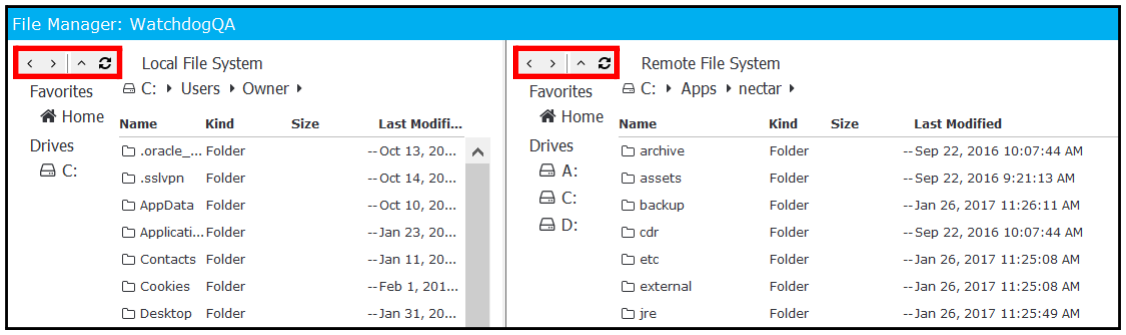
Figure 8-4 File Manager Icons
8.2.4 Drives
A vertically stacked list of drives that are found on the Local/Remote File Systems are displayed in the left-hand portion of the File Manager panes.
- For a Windows environment, one or more drive icons will exist.
- For a Linux environment, there should only be one drive, which will contain a forward slash (/), signifying root.
If you click on a drive, the contents of that pane are updated with a couple of caveats:
- If you have already navigated to a location on that drive during the current session, the contents of that location are displayed.
- If you have not navigated to a location on that drive during the current session, then the root contents for that drive are displayed.
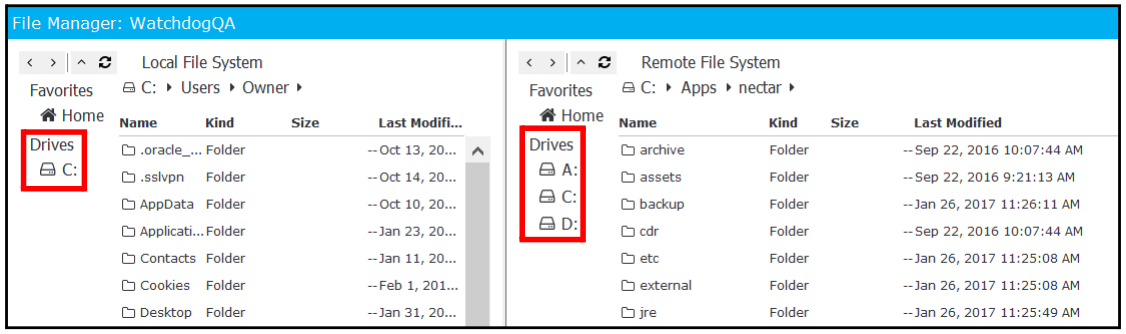
Figure 8-5 Drives
8.2.5 Breadcrumb Paths
Directory breadcrumb paths exist below the Local File System and Remote File System titles. Each breadcrumb is a live link to the actual directory/drive, except for the last breadcrumb. This is the actual directory you are currently viewing.
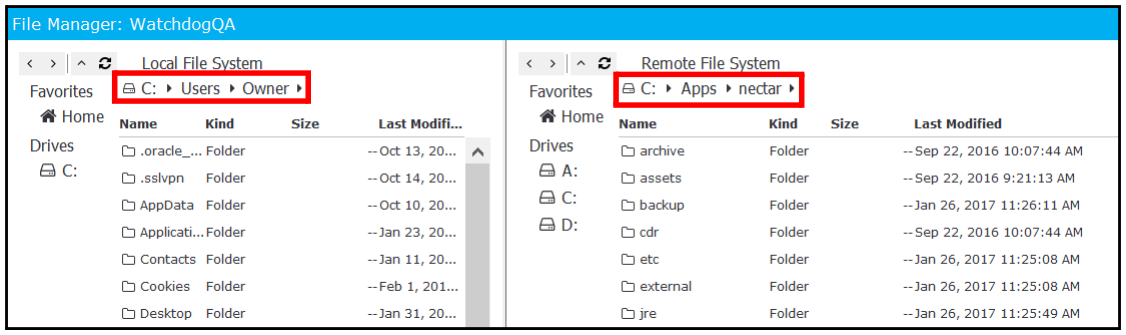
Figure 8-6 Breadcrumb Paths
When you click on an arrow (>) between the breadcrumbs, a pop-up window appears, showing a list of directories for the breadcrumb located to the left of the selected arrow. For example, in Figure 8-7 the arrow (>) following Users is selected, so the list of directories that appear is for Users.
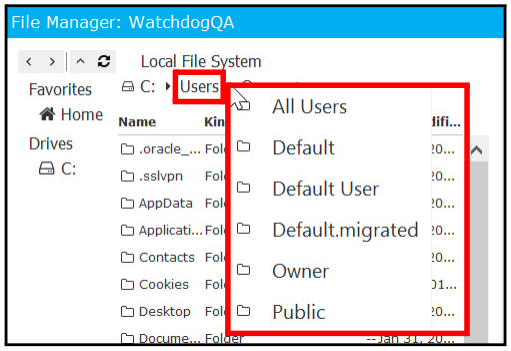
Figure 8-7 Breadcrumb Arrow (>) Menu of Directories
8.3 Move Files and Directories
This section explains how to upload and download files between your local and remote file systems, including:
- Select Files and Directories
- Drag and Drop Files and Directories
- Upload Files/Directories from Local File System to Remote File System
- Download Files/Directories from Remote File System to Local File System
8.3.1 Select Files and Directories
File Manager allows you to select multiple files and directories by holding down the Ctrl key and clicking on the desired files/directories.
You can also use a common keyboard shortcut to Select All (Ctrl-A).
8.3.2 Drag and Drop Files and Directories
File Manager allows you to use a standard “drag-and-drop” feature to move files between panes.
Note: You can drag-and-drop files/directories from a Windows Explorer window to the Remote File System pane, not vice versa.
8.3.3 Upload Files/Directories from Local File System to Remote File System
Follow these steps to upload files/directories from your Local File System to the Remote File System:
- Select the drive/directory location in the Local File System pane containing the files/ directories you will upload to the Remote File System.
- Select the files/directories you will upload.
- Right-click on the files/directories and select Upload:
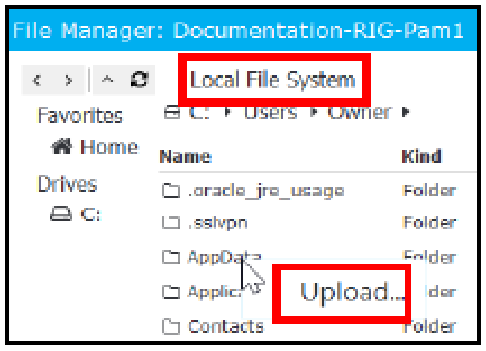
Figure 8-8 Upload File from Local File System
- The Upload File dialog box appears, where you have these additional selection options:
- Check box is located to the left of each selected file/directory. You can deselect/select these if you change your mind about which files to upload.
- The Deselect All/Select All toggle button can be used to select/deselect all files/ directories.
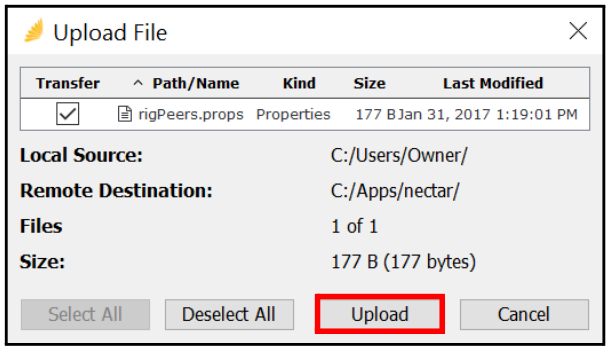
Figure 8-9 Upload Files
-
Click the Upload button to begin the upload process.
A File Transfer Status dialog box appears with the following information:
- The top progress bar shows the upload progress for all selected files/directories. The Cancel icon to the right of this bar allows you to cancel the entire upload.
- The bottom progress bar shows the progress of the file currently being transferred with an estimated time until completion.
Note: If only a single file is being transferred, then only one progress bar (the bottom bar) appears.
8.3.4 Download Files/Directories from Remote File System to Local File System
Follow these steps to download files/directories from your Remote File System to the Local File System:
- Select the drive/directory location in the Remote File System pane containing the files/ directories you will download to the Local File System.
- Select the files/directories you will download.
- Right-click on the files/directories and select Download:
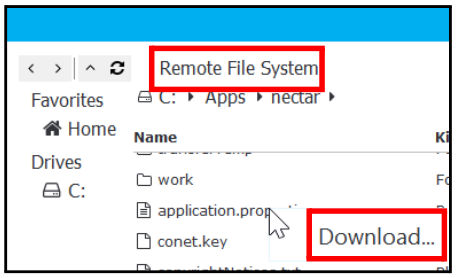
Figure 8-10 Download File from Remote File System
- The Download File dialog box appears, where you have an additional selection option.
- The Deselect All/Select All toggle button can be used to select/deselect all files/ directories.
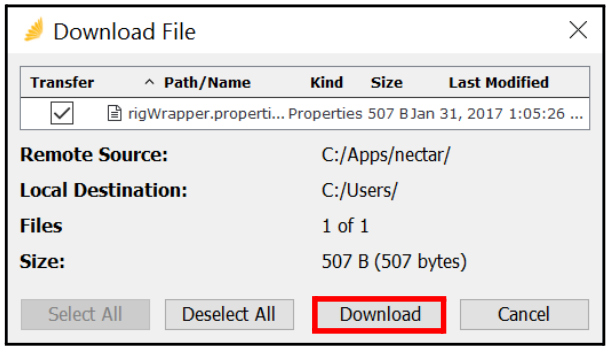
Figure 8-11 Download Files
-
Click the Download button to begin the download process.
A File Transfer Status window appears with the following information:
- The top progress bar shows the download progress for all selected files/directories. The Cancel icon to the right of this bar allows you to cancel the entire download.
- The bottom progress bar shows the progress of the file currently being transferred with an estimated time until completion.
Note: If only a single file is being transferred, then only one progress bar (the bottom bar) appears.
9. RIG Connectivity and Logs
This section provides information about the following:
- Command Line
- Maritime Terminal
- Remote Desktop
- Log Tails
9.1 Command Line
The Command Line function creates a Telnet-based connection between your local client application and the far-end RIG. The Command Line of a targeted RIG is actually a local RIG emulation of the Windows command line that is fed through a Telnet session.
- Navigate RIG > Admin > Command Line.
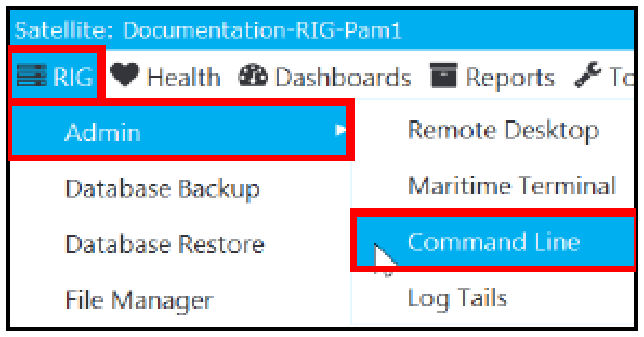
Figure 9-1 RIG > Admin > Command Line
The Telnet Command Line window appears.
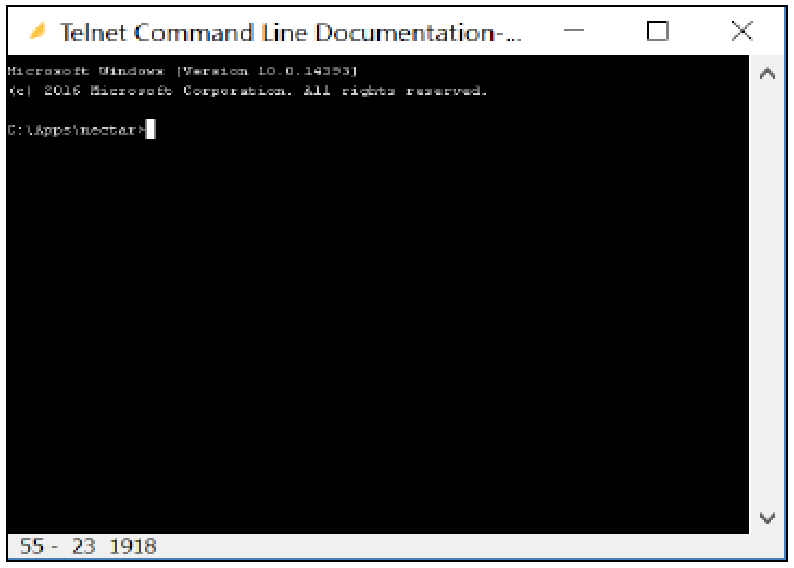
Figure 9-2 Command Line
You can run quick remote O/S level commands from the Command Line function. An example would be to ping an element or conduct trace routes directly from the RIG at the client premise.
The command line is produced through a telnet session. Similar in communication methods as the Terminal Services session to the RIG, the telnet session is launched off of the local host where the Client Application is running and SRSTP transfers the communication from the Client Application to the CIP and then to the Client RIG.
9.2 Maritime Terminal
The Maritime Terminal function is a command line interpreter for the RIG software and it is reserved for advanced and support related functions. This function establishes communication directly with the governing software system of the remote RIG system, or better known as the CLI (Command Line Interface).
There is a separate reference guide for Maritime commands. Please refer to that manual for Maritime commands. We encourage that you do not leverage the Maritime Terminal except when VKMs that require specific commands must be run from the CLI.
- Navigate to RIG > Admin > Maritime Terminal.
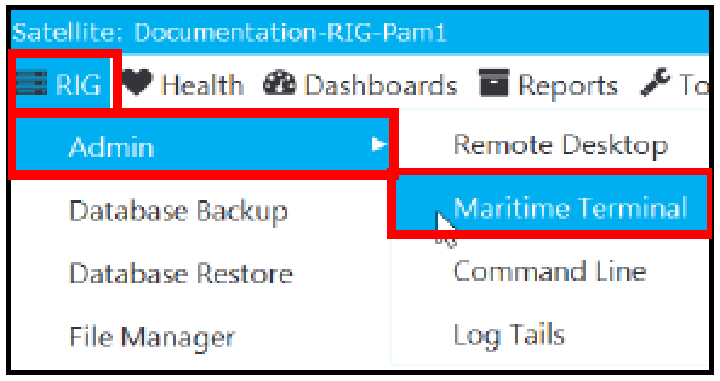
Figure 9-3 RIG > Admin > Maritime Terminal
The Telnet Martime Terminal window appears.
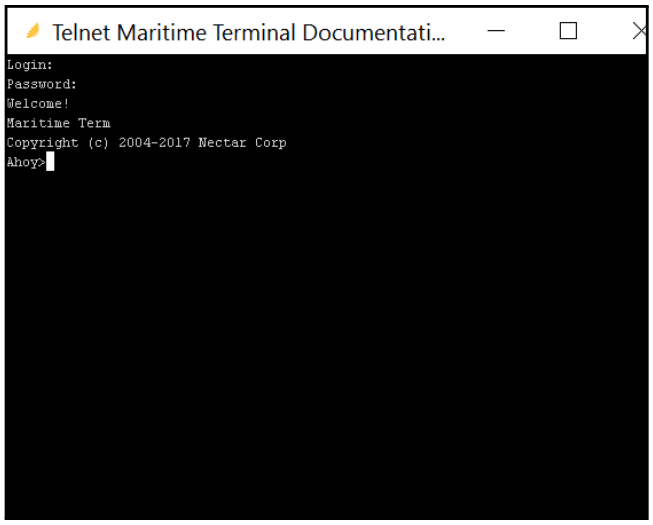
Figure 9-4 Maritime Terminal
9.3 Remote Desktop
The Remote Desktop function will immediately launch a Microsoft Terminal Services session (also known as a RDC session) from your local computer to the RIG server. Make sure that your local machine does not have any firewalls that will prevent the RIG from reaching the information source.
It is important to note that RDP can take default values of the default.rdp file stored in your user profile within your Windows O/S environment. To make certain that you have the Remote Desktop experience you are looking for (e.g., make remote drives available and establish a comfortable display setting), login into RDP directly (at the command line, type MSTSC) and save your preferred settings into a file called default.rdp.
The system will create a local Socket Tunnel that arranges for TCP communication from the CAP to the target RIG system. The Microsoft Terminal Services client will use the target RIG system to pass to the far end RIG system.
- Navigate to RIG > Admin > Remote Desktop.
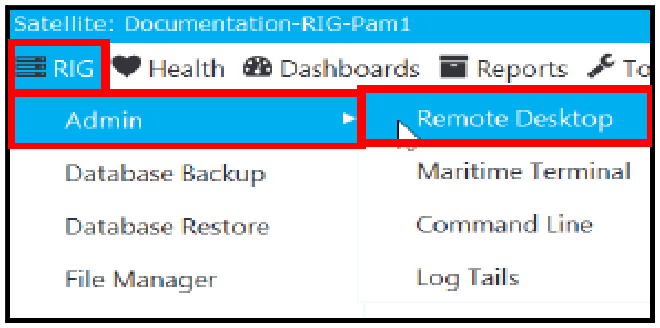
Figure 9-5 RIG > Admin > Remote Desktop
The Remote Desktop Connection dialog box appears, showing the status of the remote session connection.
9.4 Log Tails
The Log Tails function allows you to view logs in a certain log file. You can also select certain logs (or all logs displayed) and copy them to a clipboard for other use.
- Navigate RIG > Admin > Log Tails.
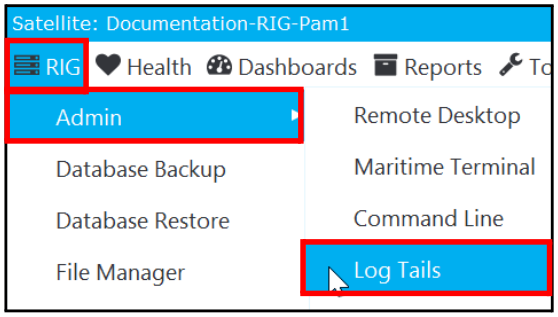
Figure 9-6 RIG > Admin > Log Tails
The Log Tails window appears.
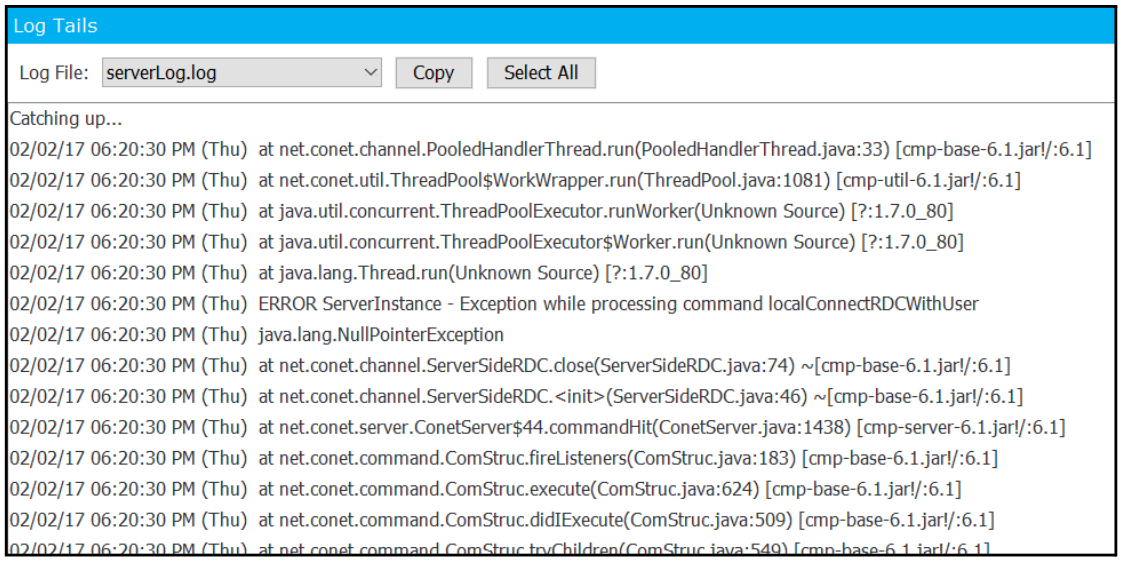
Figure 9-7 Log Tails
-
Use the Log File drop-down to select the log file that you want to view.
The log file populates in the pane below (see Figure 9-7).
-
You can also perform the following actions:
- Select one or more logs by using the Ctrl key or use Select All to select all of the logs.
- Click Copy to copy the selected logs.
- Paste the logs in a tool, such as Notepad, as needed.
10. RIG Database Backup/Restore
You can easily backup and restore the database that is associated with your RIG(s) and contains all of your RIG data.
This section provides information on the following:
- Database Backup
- Database Restore
10.1 Database Backup
The Database Backup feature backs up all data in the database. The backup goes through all of the tables that are exposed by each module on a RIG and dumps the row data into backup folder. The backed-up data does not include file-based config files, such as properties files.
Follow these steps to back up the database associated with your RIG(s):
- Navigate RIG > Database Backup.

Figure 10-1 RIG > Database Backup
The Database Backup window appears.
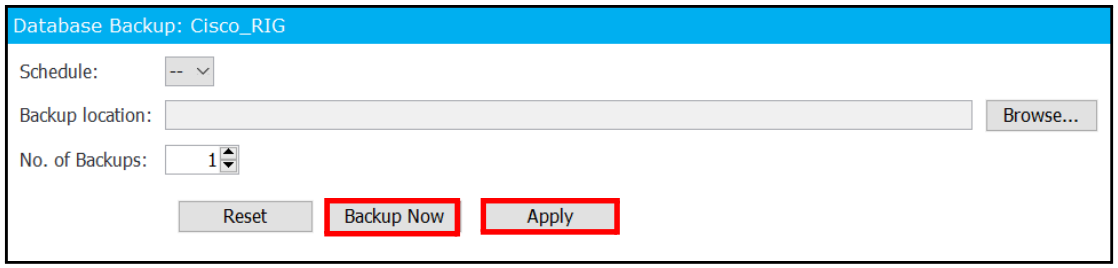
Figure 10-2 Database Backup
- Complete the following fields:
| Field | Description |
|---|---|
| Schedule | Select a backup schedule using the drop-down. For more information on schedules, see Manage Schedules. |
| Backup Location | Click Browse to navigate to the location where you would like to back up the database; then click OK. |
| No. of Backups | Specify the number of backups to keep using the up and down arrows. Any other backups will be removed. |
Table 10-1 Backup Database
-
Click Apply.
The backup will be scheduled.
-
If you want to back up the database immediately, click Backup Now.
10.2 Database Restore
The Database Restore feature restores all data from the backup folder. After performing a restore, the Client encourages you to restart your RIG(s) based on database mode (Embedded / Network). This restore does not include file-based config files, such as properties files.
Follow these steps to restore the database that is associated with your RIG(s) from a previous backup:
- Navigate RIG > Database Restore.

Figure 10-3 RIG > Database Restore
The Select Database Backup to Restore window appears:

Figure 10-4 Select Database Backup to Restore
-
Navigate to the backup file that you want to restore; then click OK.
The Confirm Database Restore window appears.
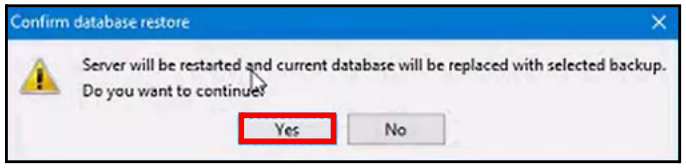
Figure 10-5 Confirm Database Restore
- Click Yes.
- If database is running in standalone mode, then the server will be restarted automatically and current database will be replaced with selected backup.
- If database is running in Network mode, then you will need to manually stop and restart the NectarRIG service using Windows Services.
11. Dependency Tree Management
This section provides information on the following:
- Dependency Trees
- Manage Dependency Trees
- Manage Dependency Tree Nodes
11.1 Dependency Trees
When network topologies converge as in the case of Voice over IP and local and wide area networks, identifying and understanding the intersection points of co-existing or reliant topologies is critical in determining root cause and calculating business impact.
A core function of Nectar Foundation APM is the ability to identify the relationships of disparate silos of technology events and data within the UC ecosystem. Dependency Trees are the underlying system that enables such correlation within the platform. Dependency Trees can be automatically generated by specific VKMs and Knowledge Scripts and adjusted to fit an actual deployment environment or manually created to illustrate in real time complex relationships between different and dependent technologies.
Take, for example, a client-server web application. The front-end web server may be coupled to a back-end transaction processing system residing on a different host, while the data may sit on a SAN or network-based storage facility. Those are three distinct systems, with each running on different hosts and reliant upon a delivery network, which can consist of several elements to connect those hosts together (such as switches, routers, and firewalls).
Given this example, Nectar Foundation APM can perform the following monitoring functions:
- Web Server:
- Host level health (CPU, memory, disk, sessions)
- Application processes
- Application logs
- Transaction Server:
- Host level health (CPU, memory, disk, sessions)
- Application processes
- Application logs
- Database queries and synthetic transactions calls
- Storage Server
- Host level health (CPU, memory, disk, sessions)
- File integrity
- File security (watching for unauthorized access)
- Network Infrastructure (switches / routers / firewalls)
- Platform level health (CPU, memory)
- Throughput measurement of key interfaces
- Port status of key ports (for example those that services above hosts or inter-network elements)
Having all of the above information would be extremely helpful when troubleshooting a complex distributed system. Dependency trees can take advantage of collections for event and performance data being taken in to the Nectar Foundation APM and leveraged with policy- based management into a single view that identifies all of the inter-device, inter-app, and inter- system relationships that exist for this singular service to function.
The trees maintain a live view of each individual element status contributing to the relationships, so there is a living breathing documentation set of a service and underlying supporting technology assets.

Figure 11-1 Dependency Tree Showing CLAN Associations
11.2 Manage Dependency Trees
Dependency trees are created per location using available elements and agents from that location. The trees maintain a live view of each individual element status contributing to the relationships. For more information on the alert value structure, see Status Summary.
Follow these steps to view dependency tree options:
-
Navigate to Configure > Dependency Trees.
The Dependency Trees window appears.

Figure 11-2 Configure > Dependency Trees
- Notice the following options on the Dependency Trees window:
-
View
-
Add
-
Edit
-
Remove
-
Emails
You can also right-click on a dependency tree and select from the following options:
-

Figure 11-3 All Elements
These options are explained in Table 11-1 and the following sections.
| Option | Used to ... |
|---|---|
| View | View the diagram of the selected dependency tree in the pane to the right. For more information, see View a Dependency Tree. |
| Add | Create a new tree diagram for system elements that need to be monitored. For more information, see Add a Dependency Tree. |
| Edit | Edit the following parameters for the dependency tree: • Enabled - Select this check box to enable the dependency tree. When enabled, Yes appears in the Enabled column. • Event Type - Select one of the following event types using the drop-down: - Normal - Returns the dependency tree to its regular state, creating events against the various alarms. - Quiet - Although the dependency tree contains live data, the alarm will not create an event for this tree. - Local - The alarms remain on the RIG and not in Intelli-Q at the CIP level. For more information, see Edit a Dependency Tree. |
| Remove | Permanently delete the entire dependency tree diagram. For more information, see Remove a Dependency Tree. |
| Enable | Activate dependency tree. When enabled, the tree updates to reflect a live status and Yes appears in the Enabled column. For more information, see Enable/Disable a Dependency Tree. |
| Disable | Inactivate the dependency tree. When disabled, No appears in the Enabled column. For more information, see Enable/Disable a Dependency Tree. |
| Event Type | Select an event type for the dependency tree from one of the following: • Normal - Returns the dependency tree to its regular state, creating events against the various alarms. • Local - The alarms remain on the RIG and not in Intelli-Q at the CIP level. • Quiet - Although the dependency tree contains live data, the alarm will not create an event for this tree. |
| Copy Dependency Tree | Copy an existing dependency tree and enter a new name for the copied dependency tree. The copied dependency tree is automatically placed in the list of dependency trees. For more information, see Copy a Dependency Tree. |
| Set Dependency Type | • Used only in unique circumstances. • Right-click on a tree and select Set Dependency Type. Enter the Tree Type and Tree Sub Type. |
Table 11-1 Options
11.2.1 View a Dependency Tree
Follow these steps to view a dependency tree:
-
Navigate to Configure > Dependency Trees.
The Dependency Trees window appears.
-
Select a tree Name in the left pane and click View to view the associated dependency tree diagram in the right pane.
Note: You can also double-click on a dependency tree Name.

Figure 11-4 View Dependency Tree
11.2.2 Add a Dependency Tree
Follow these steps to add a dependency tree:
-
Navigate to Configure > Dependency Trees.
The Dependency Trees window appears.

Figure 11-5 Add
-
Click Add.
The Add Dependency Tree dialog box appears.

Figure 11-6 Add Dependency Tree
- Enter the dependency tree Name.
- Click the Enabled check box to enable the dependency tree.
- Select one of the following event types for the new dependency tree using the drop-down:
| Event Type | Description |
|---|---|
| Normal | Returns the dependency tree to its regular state, creating events against the various alarms. |
| Quiet | Although the dependency tree contains live data, the alarm will not create an event for this tree. |
| Local | The alarms remain on the RIG and not in Intelli-Q at the CIP level. |
Table 11-2 Event Types
-
Click OK.
The new dependency tree is added to the list of trees in the Name column.
11.2.3 Edit a Dependency Tree
Follow these steps to edit a dependency tree:
-
Navigate to Configure > Dependency Trees.
The Dependency Trees window appears.
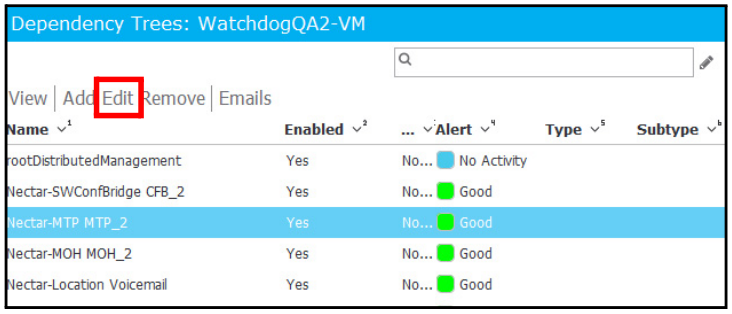
Figure 11-7 Edit
-
Select a dependency tree; then click Edit.
The Edit Dependency Tree dialog box appears.

Figure 11-8 Edit Dependency Tree
- Edit the following parameters for the dependency tree, as needed:
- Enabled
- Event Type
- Click OK.
11.2.4 Remove a Dependency Tree
Follow these steps to remove a dependency tree:
-
Navigate to Configure > Dependency Trees.
The Dependency Trees window appears.

Figure 11-9 Remove
-
Select a dependency tree to delete; then click Remove.
The Removal Confirmation dialog box appears.

Figure 11-10 Removal Confirmation
- Click Yes.
11.2.5 Enable/Disable a Dependency Tree
Follow these steps to enable/disable a dependency tree:
-
Navigate to Configure > Dependency Trees.
The Dependency Trees window appears.
-
Perform one of the following actions:
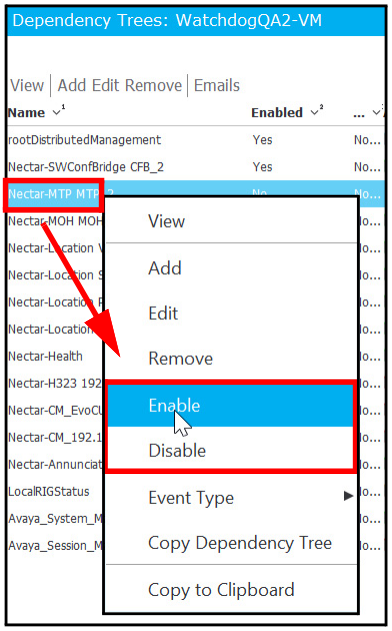
Figure 11-11 Enable/Disable Tree
- To enable a dependency tree, select the dependency tree Name in the left pane and click Enable. Yes shows in the Enabled column.
- To disable a dependency tree, select the dependency tree Name in the left pane and click Disable. No shows in the Enabled column.
11.2.6 Copy a Dependency Tree
Follow these steps to copy an existing dependency tree to create a new dependency tree:
-
Navigate to Configure > Dependency Trees.
The Dependency Trees window appears.
-
Right-click on the dependency tree Name in the left pane that you want to copy and select Copy Dependency Tree from the drop-down menu.
The Copy Dependency Tree dialog box appears.

Figure 11-12 Copy Dependency Tree
- Enter the new dependency tree Name.
- Click OK.
11.3 Manage Dependency Tree Nodes
This section explains how to manage dependency tree nodes, including:
- Parent Node Menu
- Child Node Menu
- View Node Information
- Edit a Node
11.3.1 Parent Node Menu
Right-click on a parent (top) node to view the following options:

Figure 11-13 Parent Node Menu
| Option | Description |
|---|---|
| Add | Adds additional children nodes. |
| Edit | Opens the Edit Node dialog box and allows you to change node parameters. For more information, see Edit a Node. |
| Remove All Children | • Opens the Removal Confirmation dialog box. • Permanently deletes all children of the parent node being modified. |
| Collapse Children | Collapses all children nodes under the parent node. |
| Bulk Add | • Opens the Bulk Add Nodes dialog box. • Used in unique circumstances. • Adds multiple children to a parent node. • Numerical difference between the Start Index and End Index equals the total number of children that will be created. • Enter the following and click Bulk Add: - Prefix - Node name. - Start Index - Start number associated with the node name. - End Index - End number associated with the node name. - Index Width - Leave empty to hold default or enter new value. |
Table 11-3 Options
11.3.2 Child Node Menu
Right-click on a child (second or lower-level) node to display the following menu options:

Figure 11-14 Child Node Menu
| Option | Description |
|---|---|
| Add | Adds additional children nodes. |
| Edit | Displays the Change Node window and allows you to change node parameters. |
| Remove | Permanently deletes node from the tree. |
| Clone and Replace Branch | • Copies the parent node and related children to create a new branch at the same branch level. • Simultaneously replaces a child node by entering a Search For and Replace With value. |
| Search and Replace Names | • Used in unique circumstances. • Search For field defaults to the node device. • Enter the new name into the Replace With field; name change filters throughout the tree. |
| Remove All Children | Removes all children nodes under the current node. |
| Collapse Children | Collapses all children nodes under the current node. |
| Bulk Add | • Used in unique circumstances. • Adds multiple children to a parent node. • Numerical difference between the Start Index and End Index equals the total number of children that will be created. • Enter the following and click Bulk Add: - Prefix - Node name. - Start Index - Start number associated with the node name. - End Index - End number associated with the node name. - Index Width - Leave empty to hold default or enter new value. |
| Show on Event List | Adds this node to the Current Events panel in the All Events window (Health > Events). You can then monitor this particular node if an event occurs that is tied to this node. |
| Show on Element List | Adds this node to the Devices panel in the Elements window (Health > Elements). |
Table 11-4
11.3.3 View Node Information
When you hover over a node, you can view the following node information:

Figure 11-15 Node information
| Description | |
|---|---|
| Dependency Tree Name | Displayed at the top of the node box. |
| Desc | Provides details about the node. This information will be included in the dependency tree within the alert notification email. |
| Srvc | Provides the service type being performed on the node. This information will be included in the dependency tree within the alert notification email. |
| Func | Provides the function of the node. |
| Mssg | Specifies whether or not email messages will be sent when a change occurs to the node. |
| Stat | Provides the status of the node. |
Table 11-5 Labels
Note: To change the node information, right-click on the node and select Edit. For more information, see Edit a Node.
11.3.4 Edit a Node
Follow these steps to edit a dependency tree node:
- Right-click on a node and select Edit.

Figure 11-16 Edit a Node
The Edit Node dialog box appears.
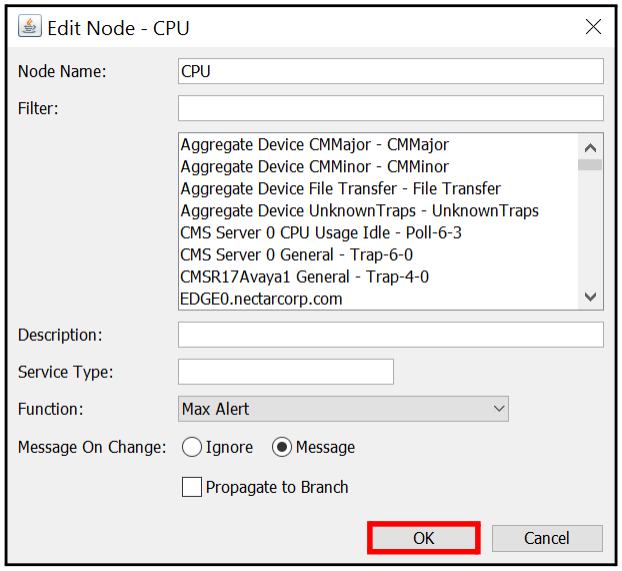
Figure 11-17 Edit Node
- Make changes to the following fields, as needed; then click OK.
| Field | Description |
|---|---|
| Node Name | Enter a name of the new node or select an existing node from the list under Filter. |
| Filter | • Used to filter the list just below it, so that you can more easily find existing node names. • If you click on one of the node names in this list (whether you filtered for it or not), it will get added to the Node Name (see above). |
| Description | Enter a description of the node. |
| Service Type | Enter the service type being performed on the node. |
| Function |  Select the function of this node using the drop-down. If you select Max Alert %, the following additional fields appear. Specify a maximum and minimum percentage for alerting as well as the threshold, such as Warning. Note: You can also select this function when adding a new node. Select the function of this node using the drop-down. If you select Max Alert %, the following additional fields appear. Specify a maximum and minimum percentage for alerting as well as the threshold, such as Warning. Note: You can also select this function when adding a new node. |
| Message on Change | Select from the following: • Ignore - This option will not send email messages when a change occurs to the node. • Message - This option causes an email notification to go out when a change occurs to the node. |
| Propagate to Branch | Select this check box to propagate node changes to the branch. |
Table 11-6 Edit a Node
11.4 Manage Email Notifications
This section explains how to:
- Set Up Email Notifications
- Edit an Email Notification
- Remove an Email Notification
- Configure Schedules
11.4.1 Set Up Email Notifications
Follow these steps to set up email notifications that will be sent when a node changes alert state:
-
Navigate to Configure > Dependency Trees.
The Dependency Trees window appears.
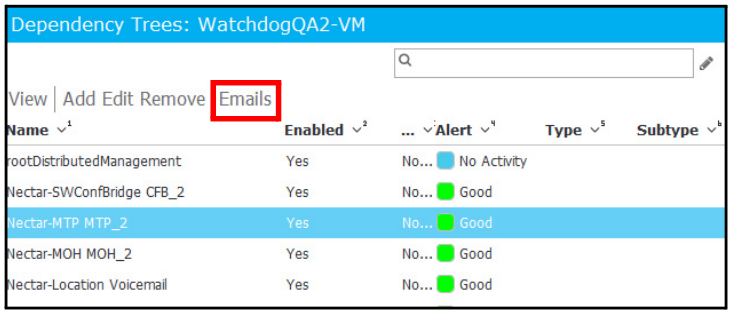
Figure 11-18 Click Emails
-
Click Emails.
The Dependency Emails window appears with the Emails tab highlighted.

Figure 11-19 Dependency Emails
-
Click Add.
The Add Email dialog box appears.
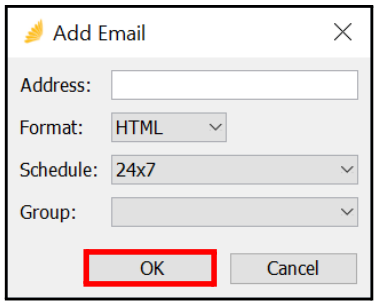
Figure 11-20 Add Email
- Enter the following information:
| Parameter | Description |
|---|---|
| Address | Enter the email address that will receive notification about alert state. |
| Format | • Select the format of the email from one of the following using the drop-down: - HTML - Plain Text • Emails can only be sent in the above formats. SMS is only available on the CIP. • Default is set to enable all new email accounts. • Notifications will be disseminated by the determined email type for all individuals and groups. |
| Schedule | Select a schedule for when email alerting will occur using the drop- down. For more information on managing schedules, see Manage Schedules. |
| Group | Assign a group using the drop-down. A group can be used to filter the events that you would like to include or exclude. An email notification will be sent when a dependency tree meets the criteria of the group. For more information, see Manage Email Groups. |
Table 11-7 Add Email
-
Click OK.
The new email appears in the Emails pane.
11.4.2 Edit an Email Notification
Follow these steps to edit an email notification that will be sent when a node changes alert state:
-
Navigate to Configure > Dependency Trees.
The Dependency Trees window appears.
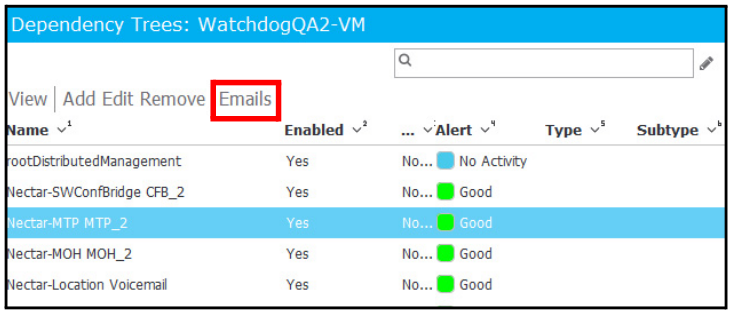
Figure 11-21 Click Emails
-
Click Emails.
The Dependency Emails window appears with the Emails tab highlighted.

Figure 11-22 Dependency Emails
-
Select an email address to edit; then click Edit.
The Edit Email dialog box appears.

Figure 11-23 Edit Email
- Make changes, as needed, to the following parameters:
- Address
- Format
- Schedule
- Group
- Click OK.
11.4.3 Remove an Email Notification
Follow these steps to remove an email notification:
-
Navigate to Configure > Dependency Trees.
The Dependency Trees window appears.

Figure 11-24 Click Emails
-
Click Emails.
The Dependency Emails window appears with the Emails tab highlighted.

Figure 11-25 Dependency Emails
-
Select an email address to remove; then click Remove.
The Removal Confirmation dialog box appears.

Figure 11-26 Removal Confirmation
- Click Yes.
11.4.4 Configure Schedules
Follow these steps to configure schedules for email notifications that will be sent when a node changes alert state:
-
Navigate to Configure > Dependency Trees.
The Dependency Trees window appears.
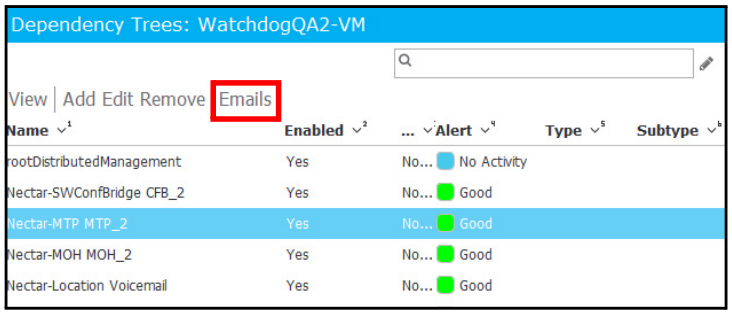
Figure 11-27 Click Emails
-
Click Emails.
The Dependency Emails window appears with the Emails tab highlighted.

Figure 11-28 Dependency Emails
-
Click Configure Schedules.
The Service Window window appears.

Figure 11-29 Service Window
For more information, see Manage Schedules.
11.5 Manage Email Groups
This section explains how to:
- Set Up an Email Group
- Remove an Email Group
11.5.1 Set Up an Email Group
Follow these steps to set up an email group:
-
Navigate to Configure > Dependency Trees.
The Dependency Trees window appears.

Figure 11-30 Dependency Trees
-
Click Emails.
The Dependency Emails window appears with the Emails tab highlighted.
-
Click the Groups tab.
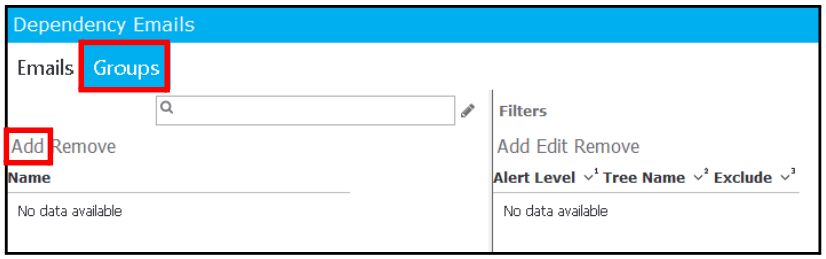
Figure 11-31 Groups Tab
-
Click Add.
The Add Group dialog box appears.
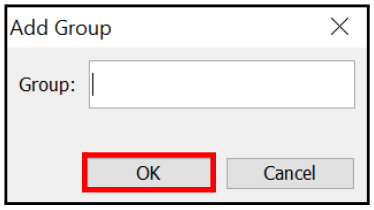
Figure 11-32 Add Group
- Enter the name of the Group; then click OK.
- To add a group filter, see Add a Group Filter.
11.5.2 Remove an Email Group
Follow these steps to remove an email group:
-
Navigate to Configure > Dependency Trees.
The Dependency Trees window appears.
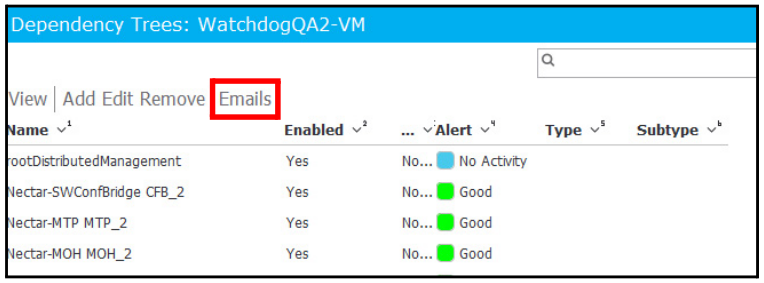
Figure 11-33 Dependency Trees
-
Click Emails.
The Dependency Emails window appears with the Emails tab highlighted.
-
Click the Groups tab.

Figure 11-34 Groups Tab
-
Select a group to remove; then click Remove.
The Removal Confirmation dialog box appears.

Figure 11-35 Removal Confirmation
- Click Yes.
11.6 Manage Group Filters
This section explains how to:
- Add a Group Filter
- Edit a Group Filter
- Remove a Group Filter
11.6.1 Add a Group Filter
Follow these steps to add a filter for a group:
-
Navigate to Configure > Dependency Trees.
The Dependency Trees window appears.

Figure 11-36 Dependency Trees
-
Click Emails.
The Dependency Emails window appears with the Emails tab highlighted.
-
Click the Groups tab.

Figure 11-37 Groups Tab
-
Select a group.
-
Click Add in the Filters pane to add a filter for the group.
The Add Group Filter dialog box appears.
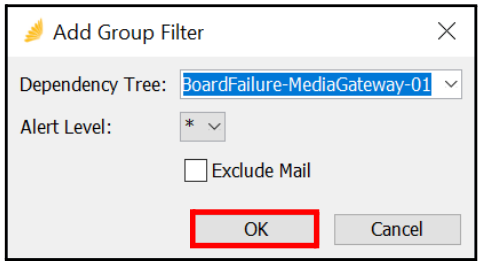
Figure 11-38 Add Group Filter
- Enter the following information for the group filter:
| Parameter | Description |
|---|---|
| Dependency Tree | Select the dependency tree associated with this group filter using the drop-down. |
| Alert Level | Select the alert level for this group filter using the drop-down. |
| Exclude Mail | Select this check box to prevent a notification email from being sent when the dependency tree triggers this alert. |
Table 11-8 Parameters
-
Click OK.
The new filter appears in the Filters pane.
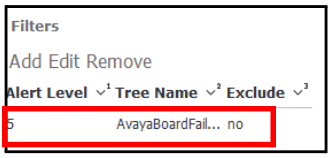
Figure 11-39 New Filter
11.6.2 Edit a Group Filter
Follow these steps to edit a filter for a group:
-
Navigate to Configure > Dependency Trees.
The Dependency Trees window appears.
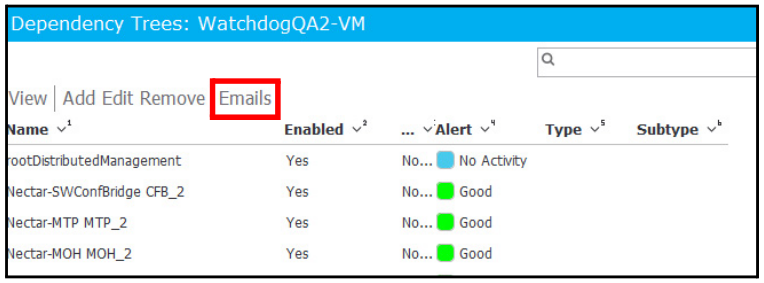
Figure 11-40 Dependency Trees
-
Click Emails.
The Dependency Emails window appears with the Emails tab highlighted.
-
Click the Groups tab.
-
Select a group; then select a filter in the Filters pane.
-
Click Edit in the Filters pane.

Figure 11-41 Edit Filter
The Edit Group Filter dialog box appears.

Figure 11-42 Edit Filter
- Make changes, as needed, to the group filter; then click OK.
11.6.3 Remove a Group Filter
Follow these steps to remove a filter for a group:
-
Navigate to Configure > Dependency Trees.
The Dependency Trees window appears.
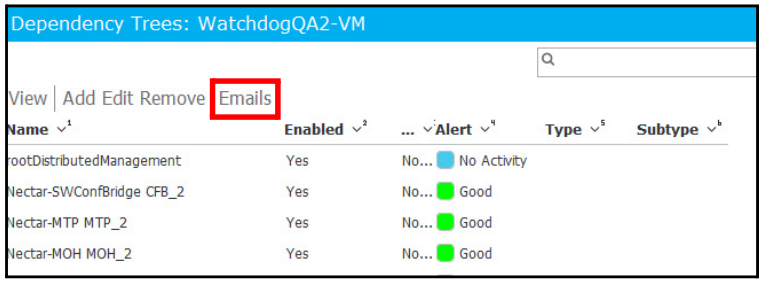
Figure 11-43 Dependency Trees
-
Click Emails.
The Dependency Emails window appears with the Emails tab highlighted.
-
Click the Groups tab.
-
Select a group; then select a filter in the Filters pane.
-
Click Remove in the Filters pane.

Figure 11-44 Edit Filter
The Removal Confirmation dialog box appears.

Figure 11-45 Removal Confirmation
- Click Yes to remove the filter.
12. Manage Dashboards and Maps
This section provides information on the following:
- Overview
- Take Inventory
- Load Existing Dashboards
- Copy Dashboards from other RIGs Using Dashboard Packs
- Configure a New Dashboard
- Maps
- View a Map in a Dashboard
12.1 Overview
Dashboards and maps enable Nectar Foundation APM to provide visualization across the management platform. They communicate the business-centric status of elements under management with the platform. Dashboards and maps are directly published to clients from the RIG and can be left open on the desktop to monitor.
Dashboards and maps provide real-time views that are presented to end clients. They also help Service Providers monitor network agents. It is important to understand the different dashboard components, which vary from client to client.
To access Dashboards, navigate to Dashboards > Dashboard.

Figure 12-1 Dashboards > Dashboard
Dashboards can have a variety of views and panels within views:
For example:
- Summary View
- Health and Performance
- Microsoft S4B KHIs
- Avaya Communications Manager (CM)
- Cisco UCM and Conferencing
- Trunks (PRIs, T1s, SIP)
- Resource Capacities (such as CLAN, MedPro, and Gateway)
- Voice Quality
- Voice Recording
12.1.1 Example: Disk Usage
This Disk Usage panel displays disk usage details:

Figure 12-2 Disk Usage Example
12.1.2 Example: Trunks Panel
The Trunk panel contains active trunk meters:

Figure 12-3 Trunks Panel
12.1.3 Example: Lync/SfB KHIs
This view contains Microsoft Lync/SfB Key Health Indicators (KHIs):

Figure 12-4 Lync/SfB KHIs
12.1.4 Example: Cisco Summary Dashboard
This view contains Cisco health and performance details:

Figure 12-5 Cisco Summary
12.1.5 Example: Avaya Dashboard
This view contains Avaya health and performance details:
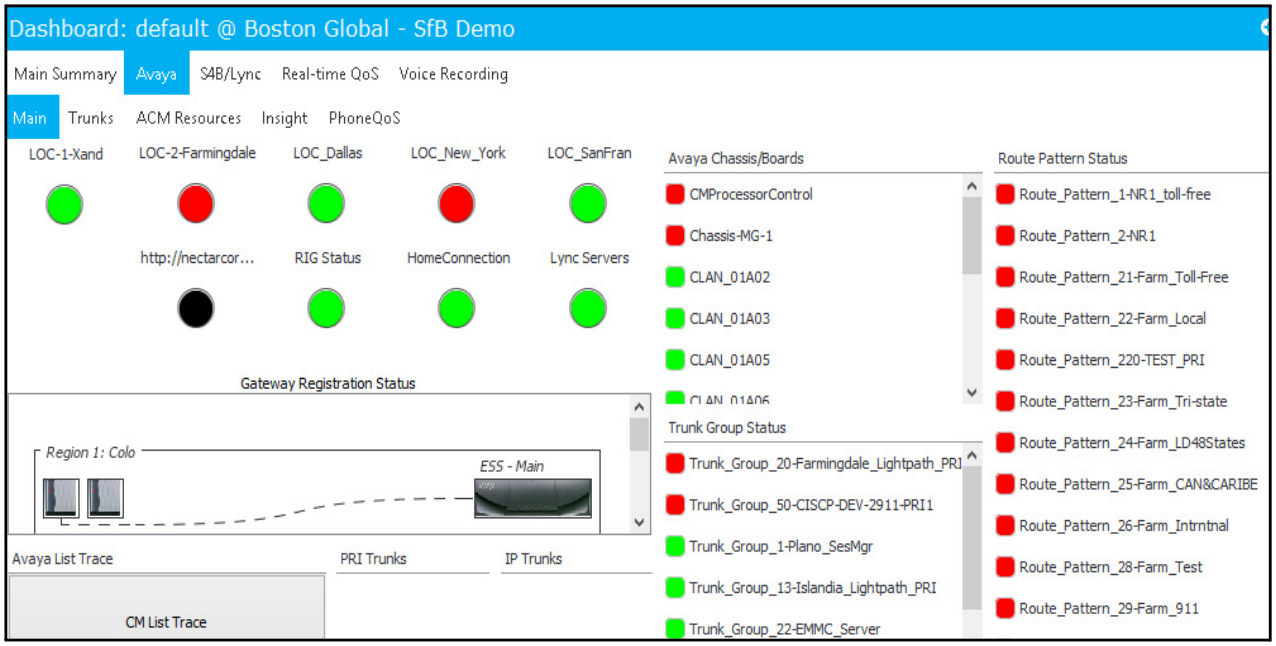
Figure 12-6 Avaya Dashboard
12.1.6 Example: Voice Quality
This Voice Quality view contains details on:
- Voice Quality for Phone, Perspective, or All
- Media Processor
- Search Filter

Figure 12-7 Voice Quality
12.1.7 Example: Voice Recording
This Voice Recording view contains status details on voice recordings:

Figure 12-8 Voice Recording
12.1.8 Example: Reports
This view contains a list of reports. You can view a report by double clicking on it:
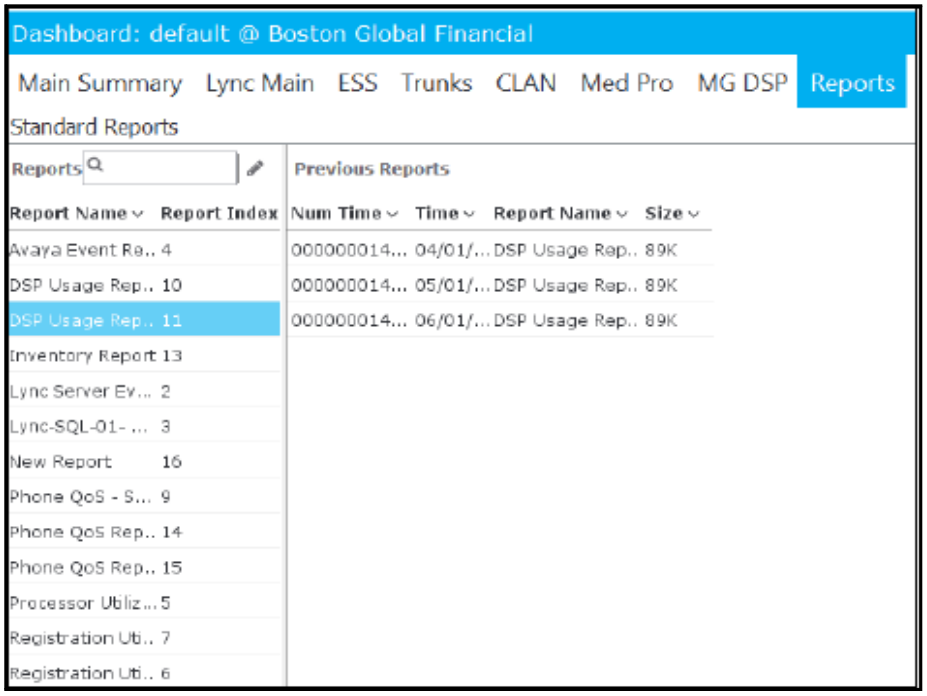
Figure 12-9 Reports
12.2 Take Inventory
Dashboards allow you to summarize system health information by combining view components onto one or more pages that are visible to the user.
Before creating any dashboards, you should understand the available inventory and assets that you would like to display in the dashboards. To take inventory:
- Navigate to Reports > Inventory > <Module>.

Figure 12-10 Reports > Inventory > Avaya CM
- An inventory list appears. You can click on each of these items in the list and drill down to view inventory details.

Figure 12-11 Reports > Inventory > Avaya CM
- You can also view element details by navigating to Health > Elements and selecting an element category such as Agents.
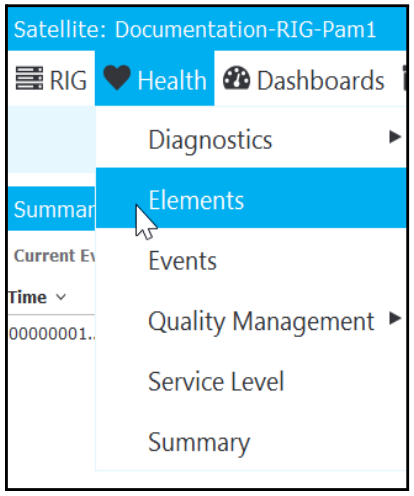
Figure 12-12 Health > Elements
- Select one of the following elements and drill down to view details:
- Folders
- Chassis
- Subnets
- Agents
- Poll Functions
- Element Registry

Figure 12-13 Elements
- You can also take an inventory by viewing existing dashboards. Navigate to Dashboards > Dashboard. Gathering this information will better prepare you to configure and manage your dashboards.
12.3 Load Existing Dashboards
To load an existing dashboard:
- Navigate to Dashboards > Dashboard:
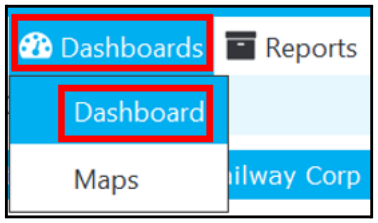
Figure 12-14 Dashboards > Dashboard
- Click the Configure Dashboard icon in the top right corner of the Dashboards page.

Figure 12-15 Configure Dashboard Button
- The Load Dashboard window appears where you can select a dashboard to view. Then, click Load.
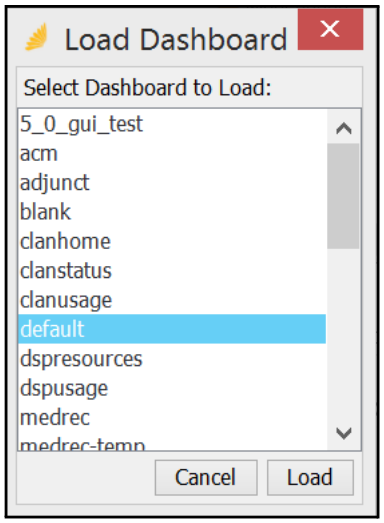
Figure 12-16 Load Dashboard
12.4 Copy Dashboards from other RIGs Using Dashboard Packs
If you have a dashboard set up on an existing RIG and want to copy it to another RIG, you can do so using the Dashboard feature:
- Navigate to Configure > Dashboard:

Figure 12-17 Configure > Dashboard
- A list of existing dashboards appear in the Configure Dashboard panel.
- Select the dashboard you want to load onto another RIG. Use the CTRL key to select multiple dashboards.
- Right-click and select Export:

Figure 12-18 Export Dashboards
- Navigate to a location where you can temporarily save the exported dashboard and then click Save:
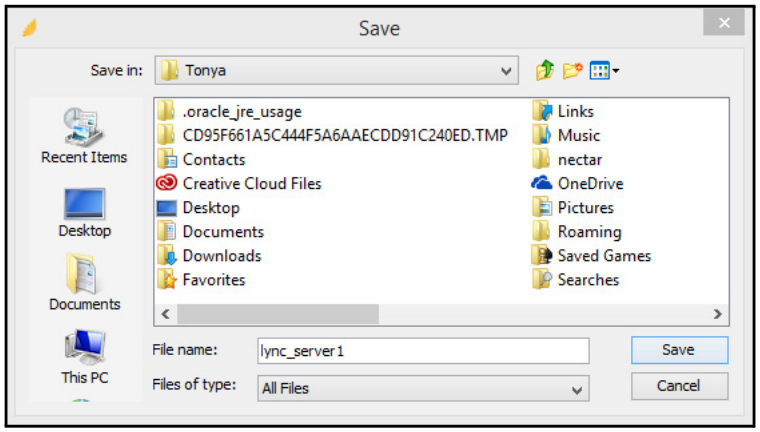
Figure 12-19 Save Exported Dashboard
- Access the new RIG to which you will import the dashboard(s) you exported.
- Navigate to Dashboards > Configure Dashboard.
- Right-click in the Configure Dashboard panel and select Import:

Figure 12-20 Import Dashboard
- The Open dialog appears (similar to the Save dialog), where you can browse to the dashboard file you saved earlier. Click Open to begin the import process.
- The selected dashboard(s) are imported into the new RIG and can be accessed in the Configure Dashboard panel.
12.5 Configure a New Dashboard
To begin configuring dashboards:
- Navigate to Configure > Dashboard.

Figure 12-21 Configure > Dashboard
The Configure Dashboard page appears:

Figure 12-22 Configure Dashboard
- Right click anywhere in the left Configure Dashboard panel, and select Add in the menu:

Figure 12-23 Add New Dashboard
- In the Add Dashboard window, enter a name for the new dashboard and then click Add:

Figure 12-24 Add Dashboard Window
12.5.1 Dashboard Layout
To begin configuring the dashboard’s layout, select the Layout radio button in the top right corner of the Configure Dashboard page to enter Layout Mode.

Figure 12-25 Layout Radio Button
Create Containers
Create a new container by using your mouse in the white space. Press your right mouse button and drag a container line (red highlighted line) to create as many containers as you want to create of any size. You will define the container properties in Dashboard Content.

Figure 12-26 Create Container
Container Menu
You can also right click on any container in the Layout panel to display a menu with these options:
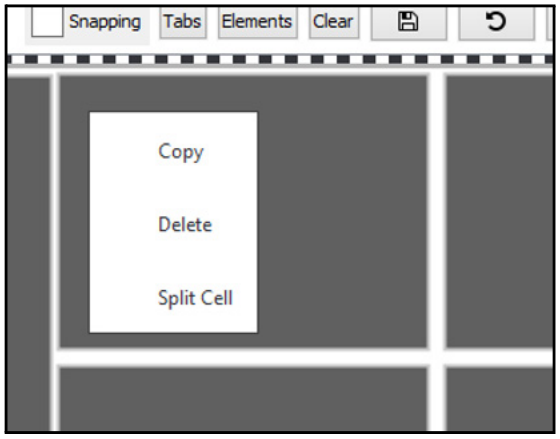
Figure 12-27 Layout Menu
- Copy: Select this to copy the selected container. Then, right click where you want to place it in the Layout panel and select Paste from the menu.
- Delete: Select this to delete the current container.
- Split Container: Select this to invoke the Split Dashboard Cell window where you can split up the current container into a specified number of evenly shaped rows and columns. You can also configure the horizontal and vertical gaps. Click Split to invoke the split

Figure 12-28 Split Dashboard Cell
Repositioning Containers
You can also reposition containers within Layout Mode by dragging and dropping them into the position where you want them.
Snapping Check Box
Select the Snapping check box to assist you in lining up your containers.

Figure 12-29 Snapping
12.5.2 Dashboard Content
To configure the dashboard’s content:
- Select the Content radio button in the top right corner of the Configure Dashboard page to enter Content Mode.

Figure 12-30 Content Mode
- To assign a component to a container, place your cursor in the top portion of the container (indicated in this figure with a red box). This displays the Dashboard Component window, where you will select a component to assign to this container. Then, click Apply:

Figure 12-31 Assign Dashboard Component
- In Content Mode, you can edit the content of the various containers by clicking the Edit icon and changing details in the resulting window:

Figure 12-32 Edit Element
12.5.3 Dashboard Elements
To manage the elements that are displayed in a given dashboard:
- Click the Elements button in the top right corner of the Configure Dashboard page.

Figure 12-33 Elements Button
- The Elements window appears, where you can drill down to a particular element within the Element Registry.
- Then, right click on an element and view the following options:
- Remove Device: Select this to remove a device from the Element Registry.
- Insert Event: Select this option to add an event for this particular element in the Alert Properties window. Enter the Event ID, select the alert level, and click Send Alert.
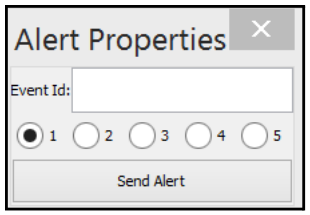
Figure 12-34 Alert Properties
- Insert Element: Select this option to insert a new element in the Element Registry.
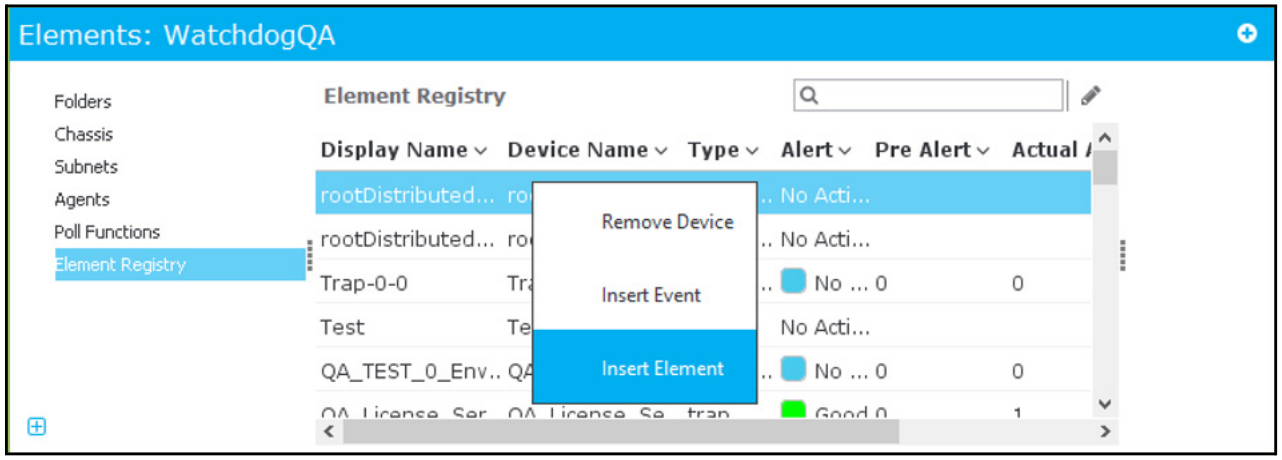
Figure 12-35 Elements Window
- To populate the dashboard, you can drag and drop an element from the Elements window into the dashboard.
12.5.4 Dashboard Tabs
A dashboard can display a variety of tabs with different details within a single dashboard:

Figure 12-36 Dashboard Tabs
To manage the dashboard tabs:
- Follow the steps in Configure a New Dashboard.
- Click the Tabs button in the upper right corner of the page:

Figure 12-37 Tabs Button
- The Manage Dashboard Tabs window appears, where you can select any dashboard on that RIG to display as a tab within that dashboard by moving from the left column to the right column. You can also rename the dashboard tabs.

Figure 12-38 Manage Dashboard Tabs Window
- Double click a dashboard tab in the left Available Dashboards column. The Dashboard Link Label window appears:

Figure 12-39 Dashboard Link Label Window
- To rename the Dashboard tab name, enter the new name in the Dashboard Link Label field and click Set.
- In the Manage Dashboard Tabs window, click Apply to apply your changes.
12.5.5 Clear Containers
To clear out all containers and provide a clean workspace:
- Make sure you are in Layout Mode.
- Click the Clear button in the upper right corner of the page:

Figure 12-40 Clear Button
12.5.6 Save Dashboard Changes
After creating or editing a dashboard tab, be sure to save your changes to the dashboard.
- After you have made changes, click the Save button.
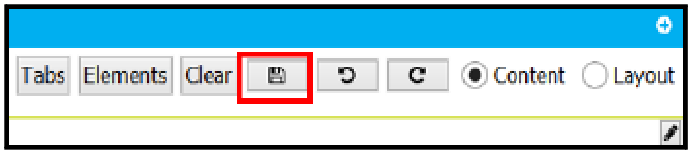
Figure 12-41 Save Button
The Save Dashboard window appears:
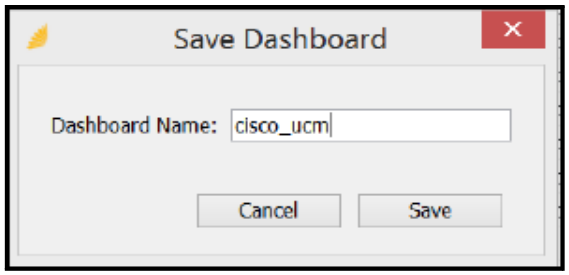
Figure 12-42 Save Confirmation
- Click Save to save the dashboard. You can also save the dashboard under a new name by entering the name in the Dashboard Name field before clicking Save.
12.5.7 Undo or Redo Dashboard Changes
You can use the Undo or Redo buttons to undo/redo changes you have made to a dashboard before clicking Save.

Figure 12-43 Undo/Redo Buttons
12.5.8 Remove a Dashboard
To remove a dashboard:
- Highlight the dashboard you want to remove in the left Configure Dashboard panel.
- Right click and select Remove in the menu:

Figure 12-44 Remove Dashboard
- In the Removal Confirmation window, click Yes to remove the Dashboard.

Figure 12-45 Removal Confirmation
12.5.9 Edit Icon
You can dashboard component and lists by clicking the Edit icon. This will launch the window associated with the component or list where you can change details.
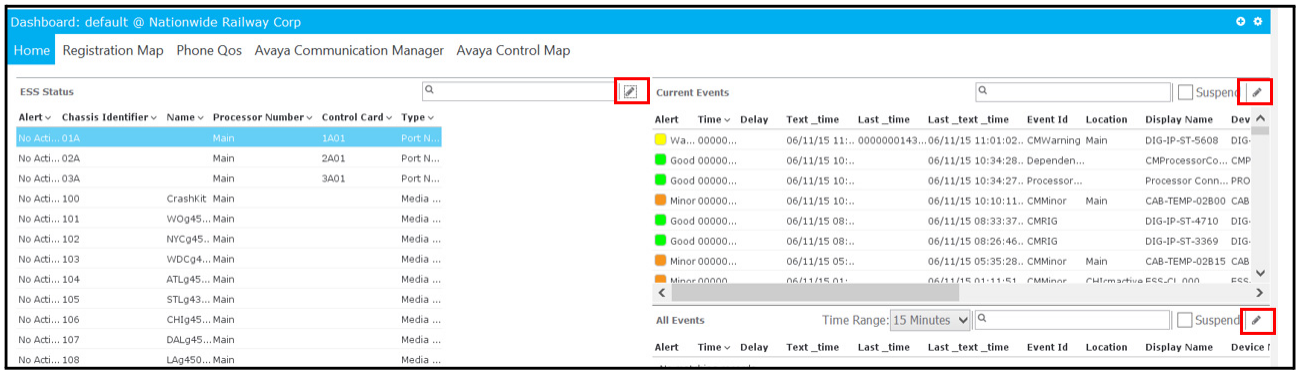
Figure 12-46 Edit Buttons
For example:

Figure 12-47 Edit Round Dial
12.6 Maps
- To access Maps, navigate to Dashboards > Maps.
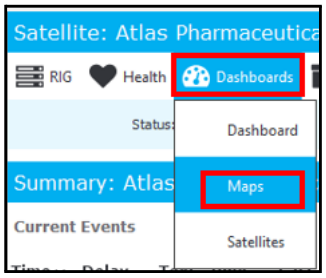
Figure 12-48 Dashboards > Maps
A list of available Maps is displayed in the left pane:
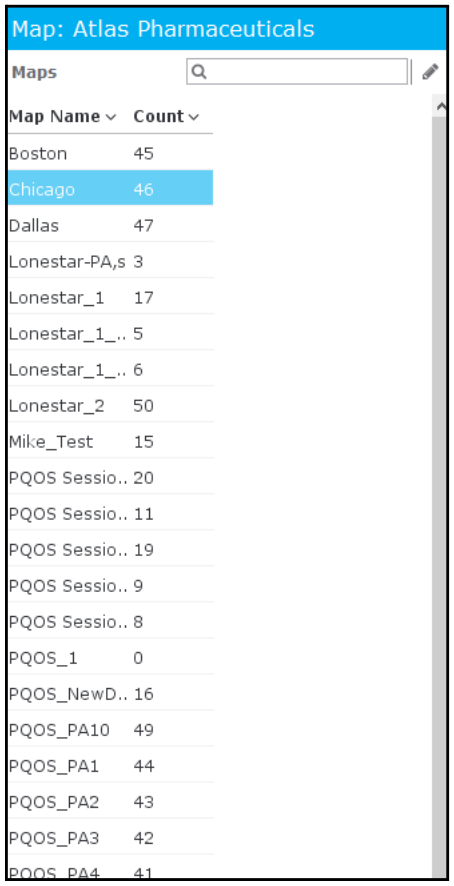
Figure 12-49 List of Maps
- Double click on a Map Name to view map details for that RIG location in the right pane:
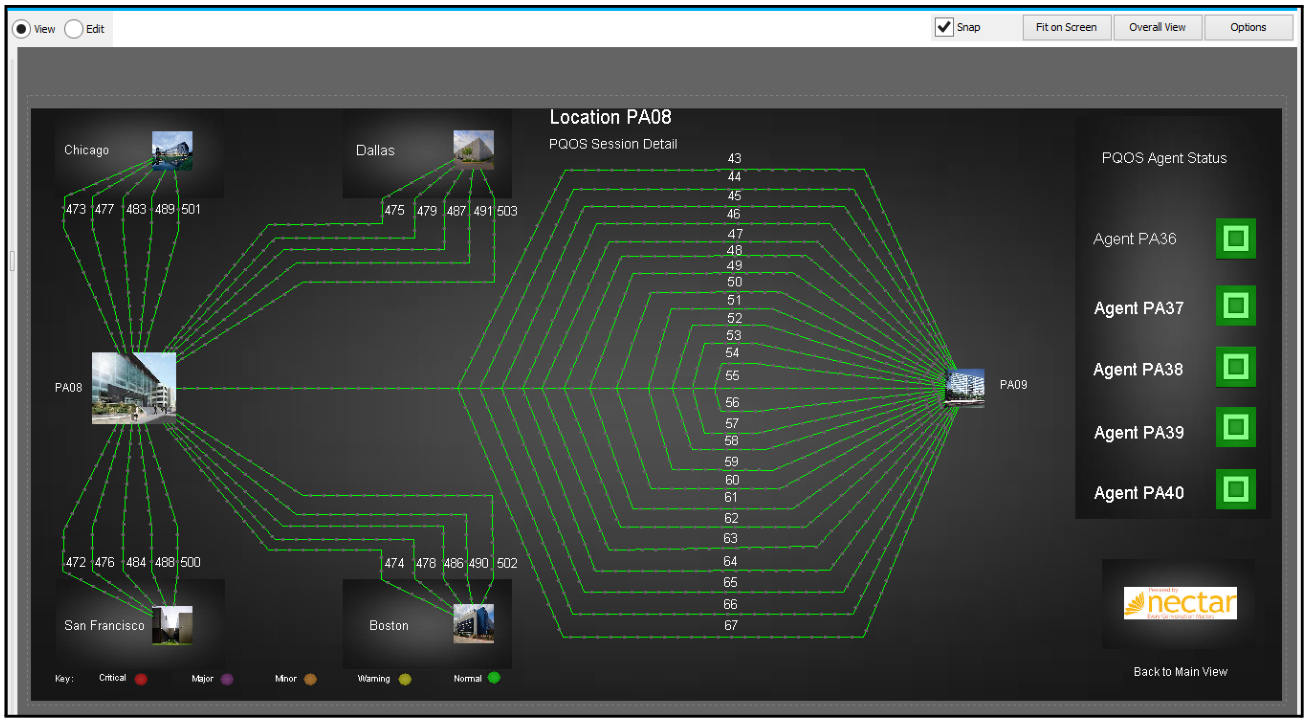
Figure 12-50 Example Map
12.6.1 Edit Maps
To enter Edit Mode:
- Click the Edit radio button in the top left corner of the window:

Figure 12-51 Edit Map
- In Edit Mode, you can:
- Drag and drop existing map components to rearrange them and resize them as needed.
- Drag up the bottom bar under a map to see a list of components. You can then drill down to a particular component and drag it into the map.

Figure 12-52 Drag Bottom Bar Up and View Map Components to Drag into Edit Map Layout
- Change the details of a map component by right clicking and selecting Edit Node Properties. For example, right clicking on this map component displays a menu with these options:

Figure 12-53 Edit Node Properties
- Edit Node Properties: Change the component’s properties.
- Remove: Remove the component all together.
- Send to Back: Send this particular element to the back (in terms of visual layers). This places the element behind other elements.
- Bring to Front: Bring this particular element to the front (in terms of visual layers). This places the element in front of other elements.
- Image: Change an existing or upload a new image for this component.
- Edit a connection between map elements by right clicking on the connection line and selecting one of the following options:
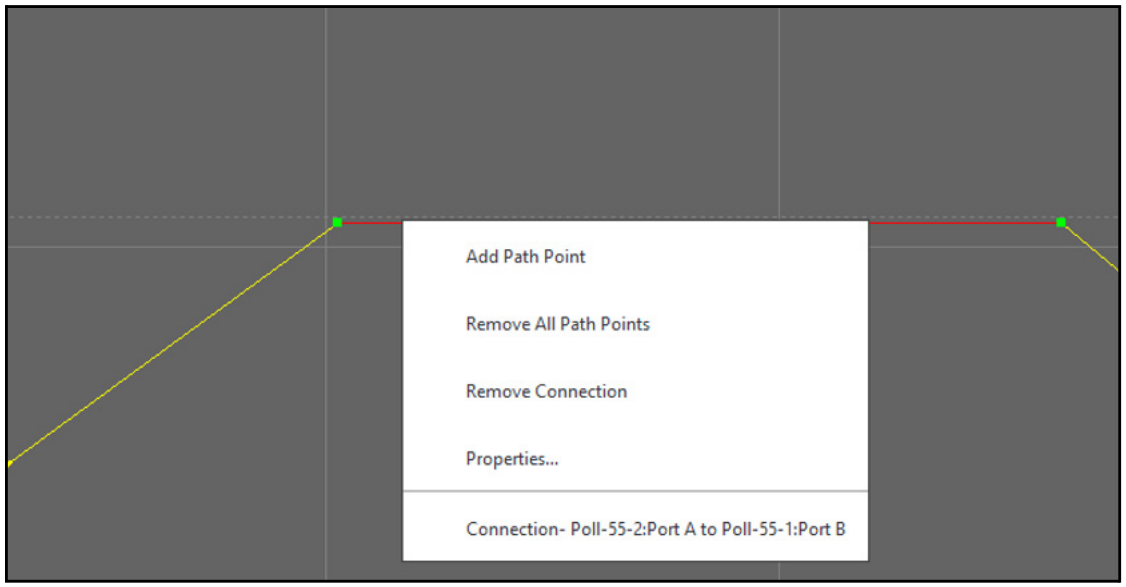
Figure 12-54 Edit Connections
- Add Path Point: Add a new path point to the connection.
- Remove All Path Points Remove all connection path points.
- Remove Connections: Remove all connections.
- Properties Configure connection properties.
12.6.2 Other Map Options
The following map options are also available:

Figure 12-55 Other Map Options
-
Snap: Select this check box to display the grid lines so you can line things up in the map as you move them around.
-
Fit on Screen: Click this button to resize the map so that it fits on your screen.
-
Overall View: Click this button to display the overall view of the map in the bottom right corner of the window. This is useful for especially large maps.
-
Options: Click this button to display two options:
a. Image Library: Select this to access the image library to import images into your map.
b. Alert Expressions: Select this to add connection and node alerts to your map.
12.6.3 Add a New Map
- To add a new map, navigate to Dashboards > Maps.

Figure 12-56 Dashboards > Maps
- In the Maps list, right click and select Add from the menu:

Figure 12-57 Maps > Add
- In the Add New Map window, enter a meaningful name for the map:
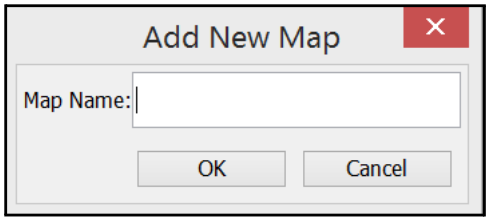
Figure 12-58 Add New Map
- Locate and click on the new map name in the Maps list to the left.
- In the right pane, right click to display the Maps menu, which has these options:

Figure 12-59 Maps Menu
- Fit to screen: Select this option so that the map fits on your screen.
- Layout Wizard > Grid Layout: Select this option to display the Grid Layout Window window where you can adjust:
- Grid Layout Width
- Grid Layout Height
- Relative Spacing
- None (No Grid)
- Smallest (Smallest Grid)
- Largest (Largest Grid)
- Click OK when you have made your changes.

Figure 12-60 Grid Layout Wizard
- Add Label: Select this option to add a text label to the map.
- Remove All: Select this option to remove all map elements
12.6.4 Remove a Map
- To remove a new map, navigate to Dashboards > Maps.

Figure 12-61 Dashboards > Maps
- In the Maps list, right click on the desired map and select Remove from the menu:

Figure 12-62 Maps > Remove
The map is removed from the system.
12.6.5 Copy Maps
You can copy an existing map, rename it, and save it as a new map to simplify the map creation process.
- To copy a map, navigate to Dashboards > Maps.

Figure 12-63 Dashboards > Maps
- In the Maps list, right click on the desired map and select Copy Map from the menu:

Figure 12-64 Maps > Copy Map
- In the New Name window, enter a name for the new map and then click OK.

Figure 12-65 New Name Window
The new map is added to the Maps list.
12.7 View a Map in a Dashboard
To view a map in a dashboard:
- Create a container, as discussed in Dashboard Layout.
- Select the Content radio button in the top right corner of the Configure Dashboard page to enter Content Mode.

Figure 12-66 Content Mode
- Place your cursor in the top portion of the container (indicated in this figure with a red box). This displays the Dashboard Component window, where you will select the Map component and click Apply.

Figure 12-67 Assign Map Component
- Define the Map container by clicking the Edit icon and defining details in the resulting window:

Figure 12-68 Edit Map Container
13. Configure Vendor Knowledge Script
A Vendor Knowledge Script (VKS) is a single-application monitoring knowledge base built to support specific, purpose-built applications.
Configuring Vendor Knowledge Scripts include the following tasks:
- Enable VKS
- Add an Agent
- Import VKS
- Give Specific Device Types Access to the VKS
- Associate VKS
13.1 Enable VKS
You must enable the Knowledge Script module.
- Log in to the RIG.
- Navigate to RIG > Module Configuration.
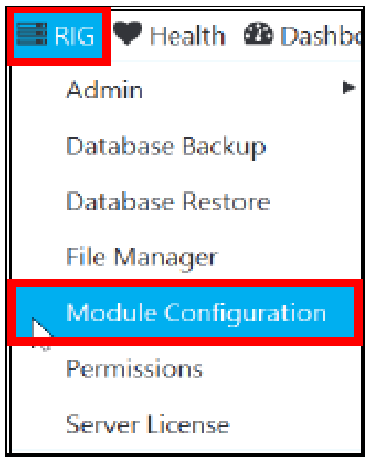
Figure 13-1 RIG > Module Configuration
- In the Module Configuration window, select Knowledge Script under Premium Modules.

Figure 13-2 Enable Knowledge Script
-
Click Apply.
-
Restart the RIG and apply the changes.
a. Navigate to RIG > Admin > Restart.
b. When the following message appears, click Yes.
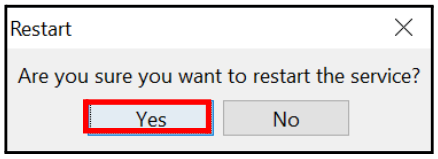
Figure 13-3 Restart
13.2 Add an Agent
Note: This section can be skipped if the agent already exists.
- Click on the Health menu and select Elements.
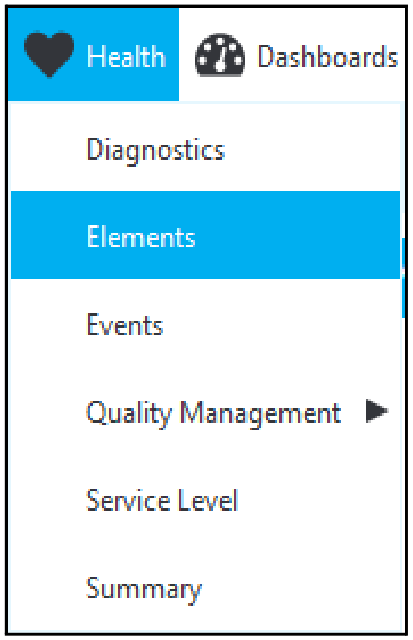
Figure 13-4 Health Menu
- When the Elements window appears, click Agents.
- Right-click anywhere in the All Agents pane and select Add.
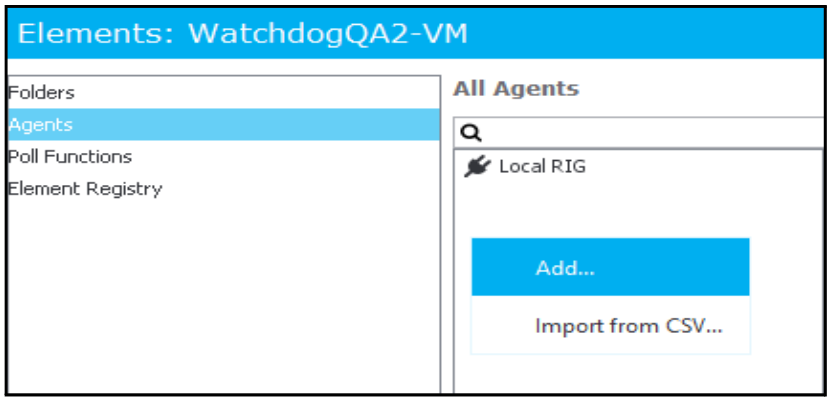
Figure 13-5 Add Agent
The Add Agent window appears.
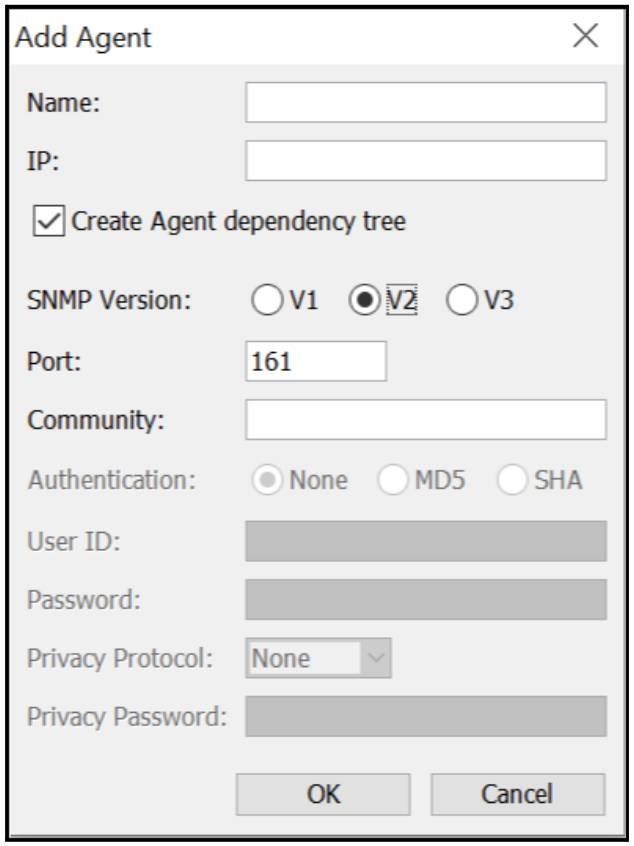
Figure 13-6 Add Agent
- Populate the fields in the Add Agent window.
| Field | Description |
|---|---|
| Name | Enter the name of the new agent. The agent is the device you will be monitoring. |
| IP | Enter the IP address of the agent/device. |
| Create Agent Dependency Tree | Select this check box if you want to create a dependency tree for the new agent. |
| SNMP Version | Select the SNMP version the device supports, such as V2. |
| Port | Enter the SNMP port. Default is 161. |
| Community | Enter the community string configured for this device, such as NectarSNMP. |
- Click OK.
The new agent appears in the All Agents pane.
13.3 Import VKS
Note: The VKS only needs to be imported once. It can then be applied to multiple devices.
- Click on the Configure Menu and select Knowledge Script.

Figure 13-7 Configure Knowledge Scripts
- Right-click anywhere in the Knowledge Script pane and select Import.

Figure 13-8 Import Knowledge Script
- Browse to the VKS file you wish to import through your Windows Explorer and double-click on, or select the file and click Open.
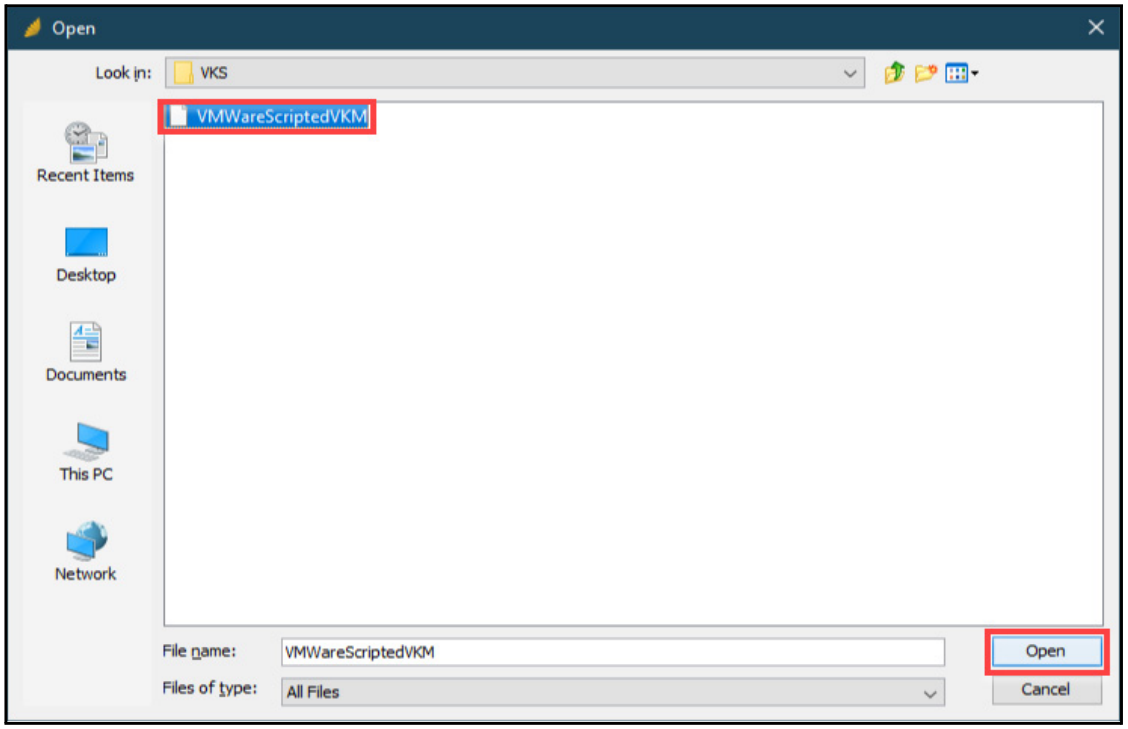
Figure 13-9 Select VKS file
Note: At this point, your VKS is added and now appears in the Knowledge Scripts
pane.
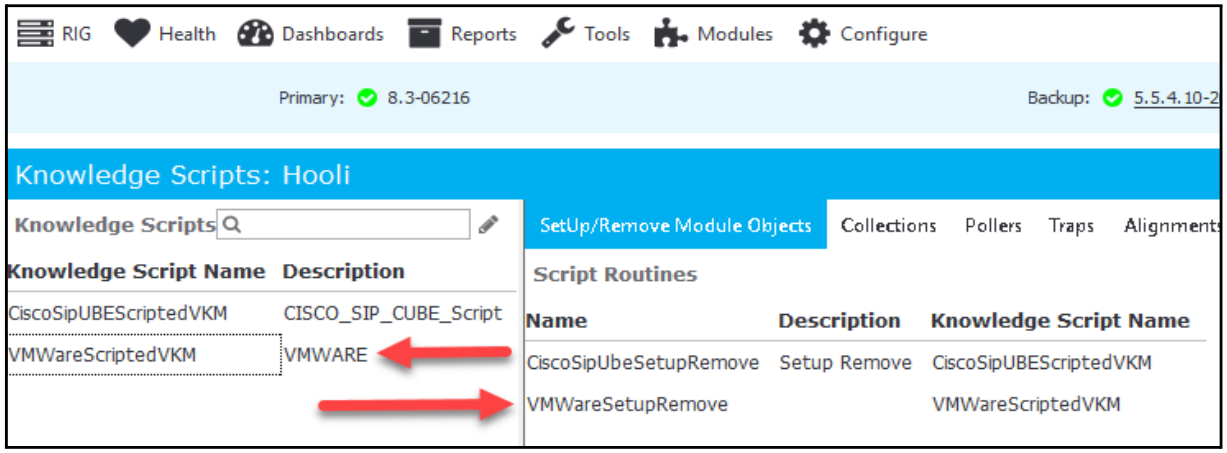
Figure 13-10 Added VKS
13.4 Give Specific Device Types Access to the VKS
Now that the VKS has been added, you need to set up the devices that can be associated with this VKS to prevent improper association with incompatible devices.
- With the applicable VKS selected, select the Devices tab
- Right-click anywhere in the Supported Devices pane and select Add.

Figure 13-11 Add Device
- When the Add Supported Devices window appears, click on the ... to the right of the System Object ID.
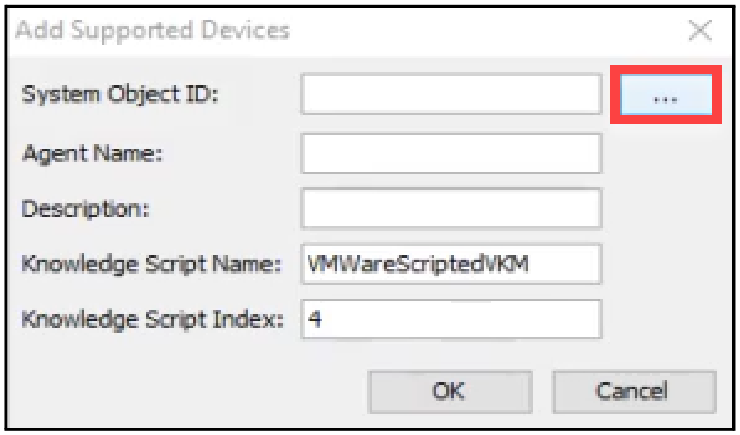
Figure 13-12 More Button
- Search for the Agent to be associated with this VKS. This action also sets up the Object ID for the device type.
- Select the agent and click Select.
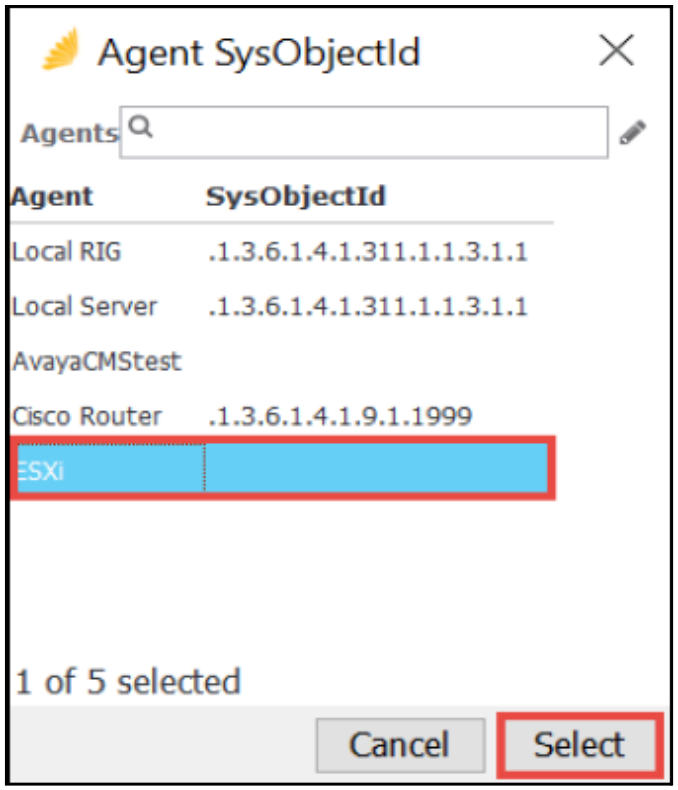
Figure 13-13 Select Agent
The System Object ID will auto-populate.
- Click Ok.

Figure 13-14 Add Supported Device
The System Object ID, agent, and VKS now appear in the Supported Device pane.
Note: The OID is not unique for the agent. However, it is unique for the version of the VKS or host/device type.
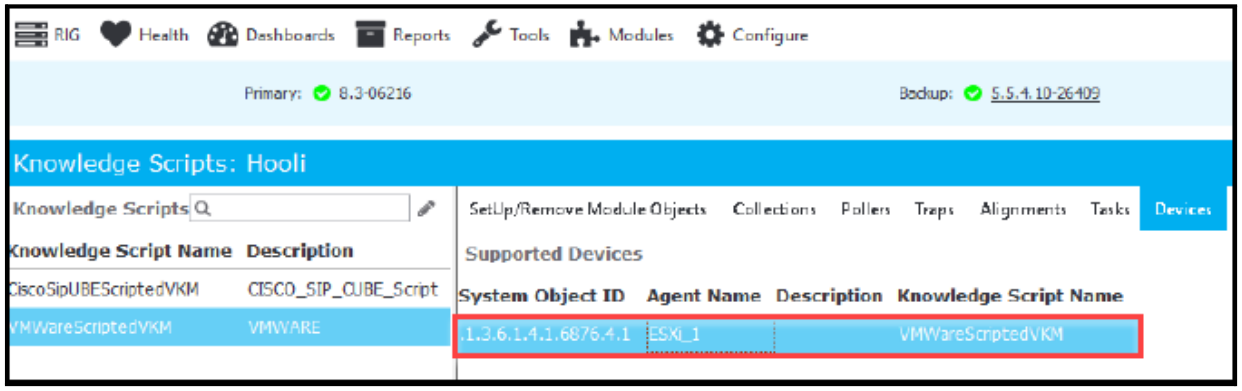
Figure 13-15 Supported Device Added
13.5 Associate VKS
Now you need to associate the agent with the VKS in order to begin polling data.
- Click on the Health menu and select Elements.

Figure 13-16 Health Menu
- When the Elements window appears, click Agents.
- Select the agent in the All Agents pane; then right-click and select Associate Knowledge Scripts.

Figure 13-17 Associate Knowledge Script
- Select the applicable VKS and click the Add button.
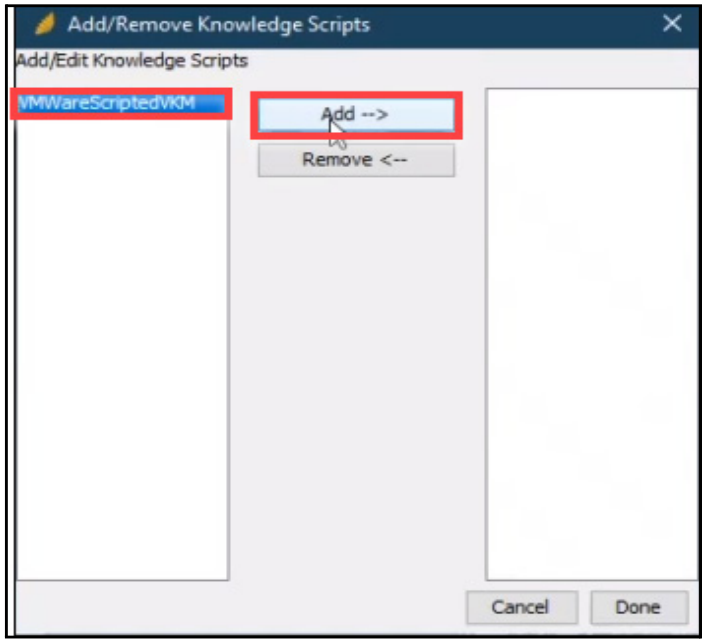
Figure 13-18 Add/Remove VKS
- Once the VKS is added, click Done.
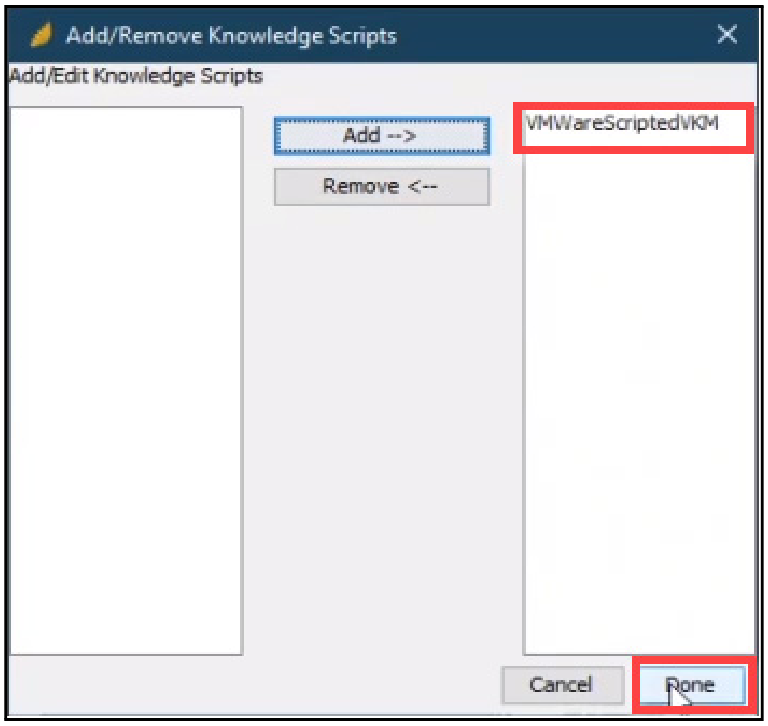
Figure 13-19 Added VKS
At this point, Poll Functions are now available and displayed in the Poll Functions pane.
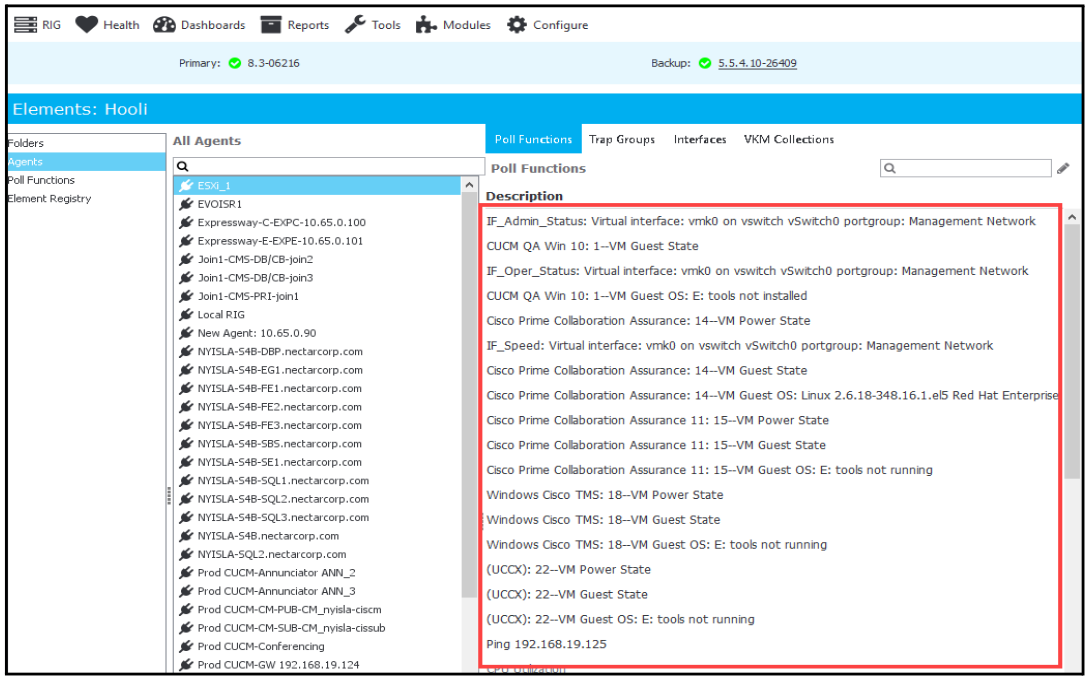
Figure 13-20 Poll Functions Displayed
14. Manage Poll Functions
Nectar Foundation APM monitoring provides the basic building blocks on element health and availability statistics, such as CPU, disk, and memory usage, process alerts, and trending of statistical information over time.
This section explains how to:
- Import/Export Poller Packs
- View Poll Functions
- Add Poll Functions - PowerShell Example
- Enable or Disable Poll Functions
- Edit Poll Functions
- Remove Poll Functions
- Export Poll Functions
Note: In order to add PowerShell-based poll functions, you must first create a domain account, configure permissions, and add and configure the agent. For more information, see:
Add Poll Functions - PowerShell Example
Create a New Domain Account in the Active Directory
Add and Configure the Agent for PowerShell
14.1 Import/Export Poller Packs
Poller packs are groupings of pollers. They allow you to monitor and manage any specific manufacturer infrastructure or application through the use of logical pollers. Once created, you can import/export poller packs across customer RIGs. This allows you to easily onboard additional assets from the manufacturer or application.
14.1.1 Import Poller Packs
Follow these steps to import a poller pack into your RIG:
- Navigate to Configure > Poll Functions:
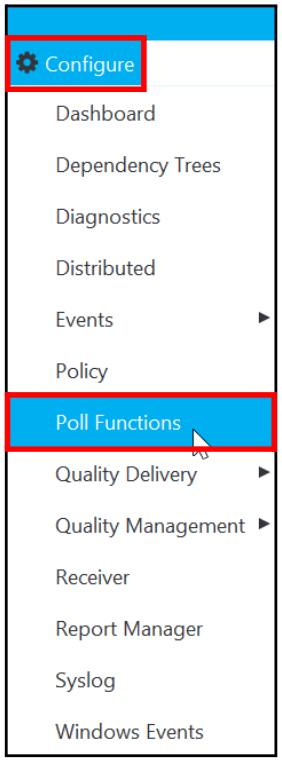
Figure 14-1 Configure > Poll Functions
- Right-click in the Poll Functions pane and select Load Pack:
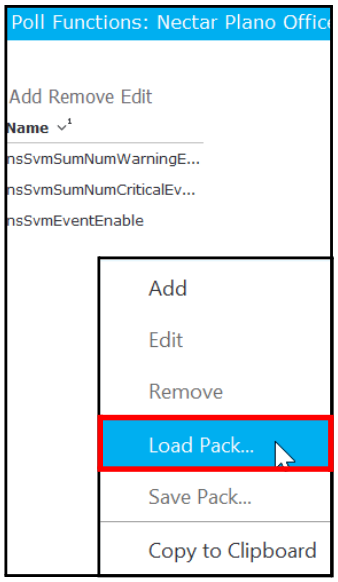
Figure 14-2 Load Pack
The Open window appears:
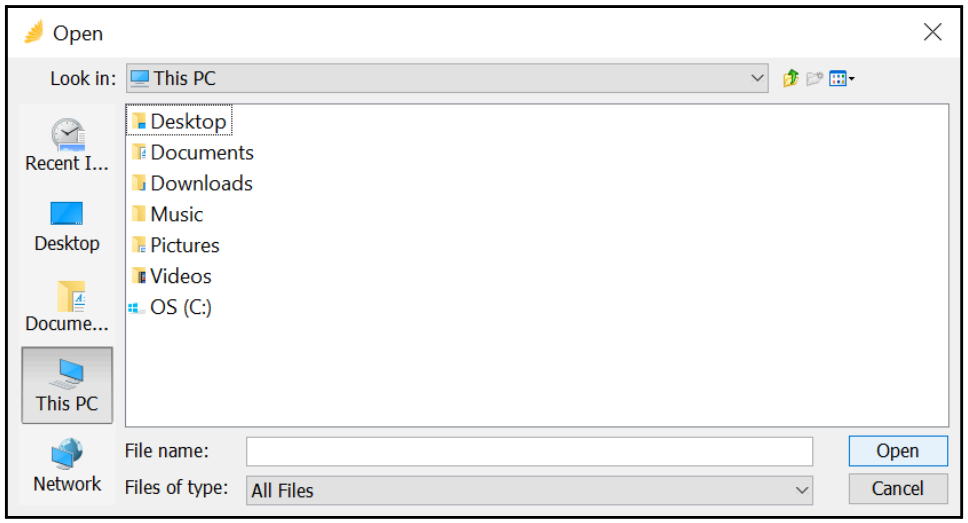
Figure 14-3 Open Window
-
Browse to the information (poller) pack and click Open to load it onto your RIG.
A status window appears temporarily letting you know that the information (poller) pack is loading.
After it is loaded, you can see it in the Poll Functions pane.
14.1.2 Export Poller Packs
Follow these steps to export a poller pack from your RIG:
- Navigate to Configure > Poll Functions:
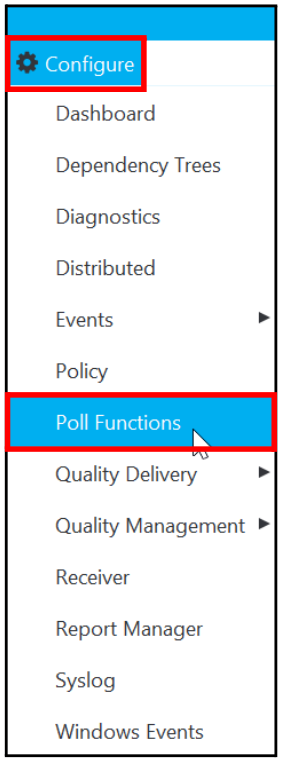
Figure 14-4 Configure > Poll Functions
- Select the poller pack(s) you want to export (for use in another RIG) in the Poll Functions pane.
Note: You can also use the Ctrl and Shift keys to select multiple poller packs in the Poll Functions pane.

Figure 14-5 Select Poller Packs to Export
- Right-click on the selected poller packs and select Save Pack.
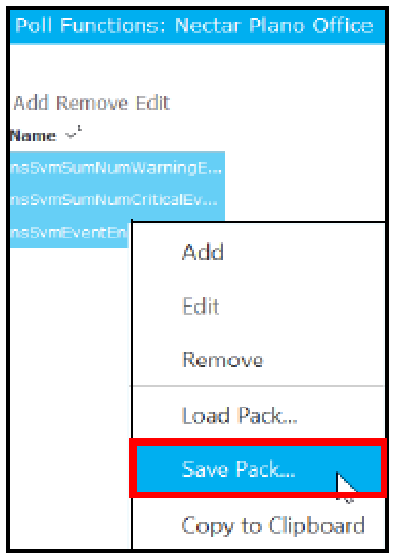
Figure 14-6 Save Poller Packs to Export
The Save Packs? window appears:

Figure 14-7 Save Packs
-
Click Save to save the poller packs.
The Save window appears where you can browse to a location to store the poller packs:

Figure 14-8 Save Window
-
Click Save.
The Saving Custom Poller Pack window temporarily appears while the poller pack is exporting.
14.2 View Poll Functions
Follow these steps to view a list of poll function for a RIG and its agents:
- Navigate to Health > Elements.
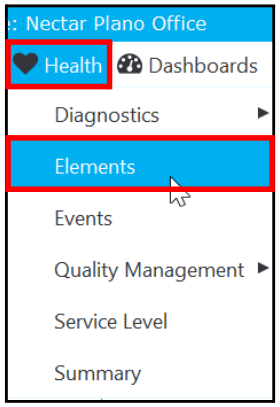
Figure 14-9 Health > Elements
The Elements window appears.
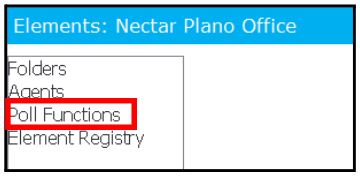
-
Select Poll Functions.
A list of agents appears under Poll Functions.

Figure 14-10 Poll Functions
14.3 Add Poll Functions - PowerShell Example
To add PowerShell-based poll functions, you must first:
- Create a New Domain Account in the Active Directory
- Add Local Administrator Permissions to Domain Account
- Add and Configure the Agent for PowerShell
- Add the PowerShell-Based Performance Poll Functions
14.3.1 Create a New Domain Account in the Active Directory
Follow these steps to create a new user in the Active Directory (AD):
- Log on to your Domain Controller.
- Open Active Directory Users and Computers with an account that has permissions to create new user accounts and assign permissions.
- Right-click on your domain and select New > User.
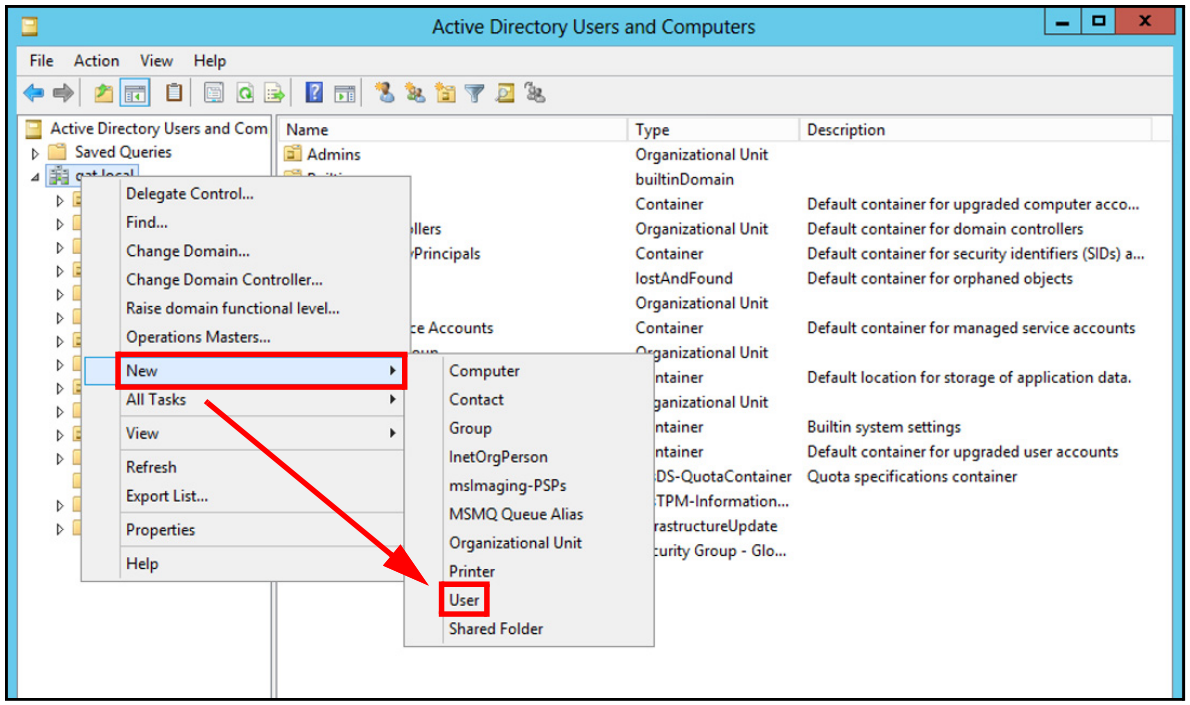
Figure 14-11 Add New User
The New Object - User window appears:

Figure 14-12 New Object - User
- Enter the following information about the new user:
| Parameter | Enter ... |
|---|---|
| First Name | First name of the new user. |
| Initial | Middle initial of the new user, if applicable. |
| Last Name | Last name of the new user. |
| Full Name | This field automatically populates when you enter First Name, Initial, and Last Name. |
| User Logon Name | Value in Full Name field to complete logon name. |
Table 14-1 New User
-
Click Next.
The New Object - User window appears.
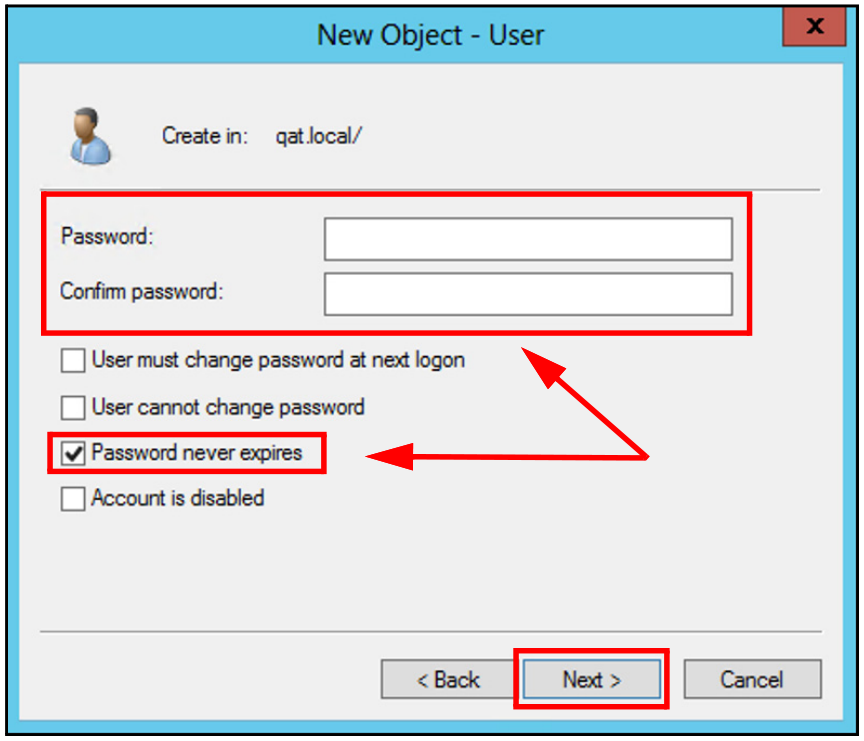
Figure 14-13 Add Password
-
Enter your Password; then confirm your password.
-
Click Password Never Expires.
-
Uncheck any other boxes, if applicable.
-
Click Next; then click Finish.
A new user is added for the PowerShell remoting.

Figure 14-14 New User
14.3.2 Add Local Administrator Permissions to Domain Account
Follow these steps to add local administrator permissions to the newly created domain account on each of the agents for which you will create a performance counter poller.
Note: You must have local administrator permissions on all servers.
- Log on to a Windows server.
- Navigate to Local Users and Groups (Local) > Groups > Administrators.

Figure 14-15 Local Users and Groups (Local) > Groups > Administrators
The Administrators Properties window appears.
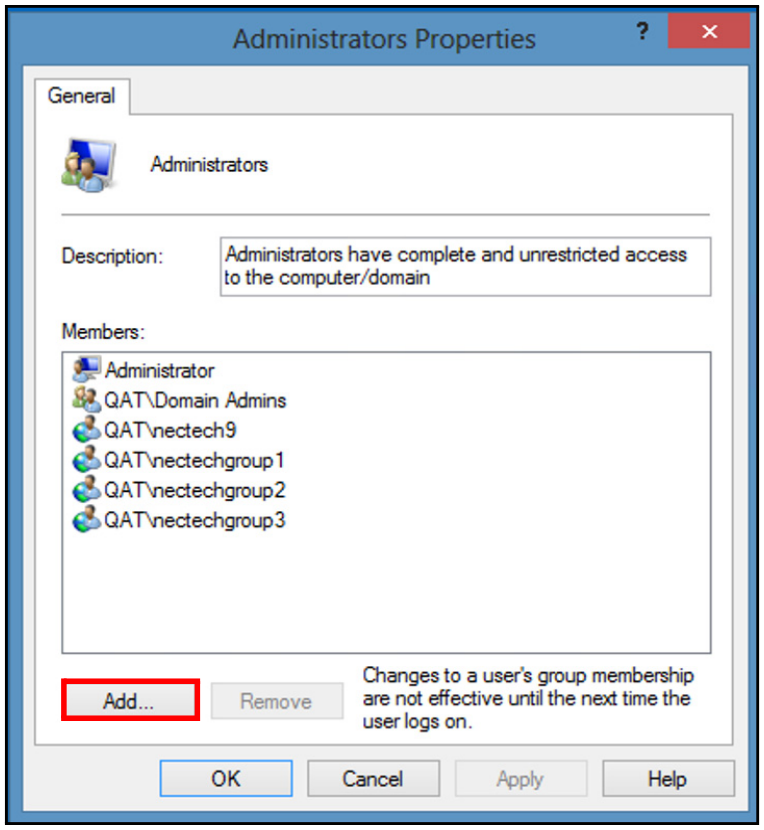
Figure 14-16 Administrators Properties
-
Click Add.
The Select Users, Computers, Service Accounts, or Groups window appears.
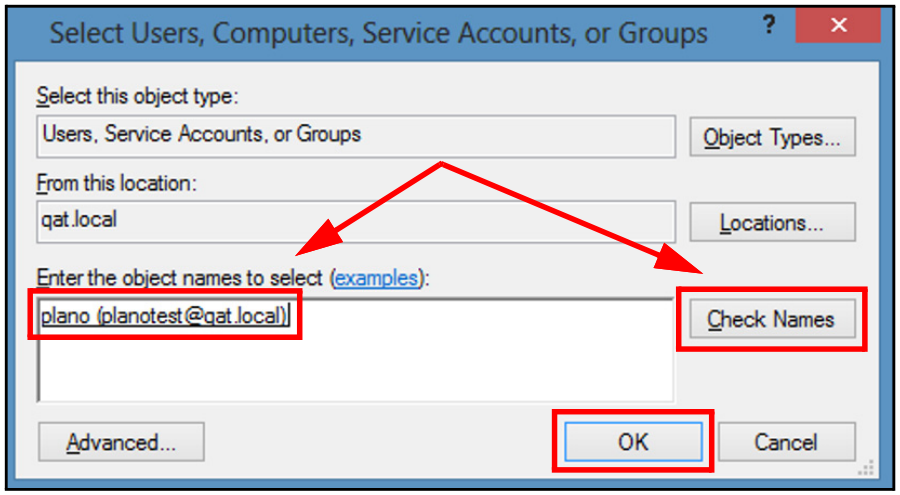
Figure 14-17 Select Users, Computers, Service Accounts, or Groups
- Enter the domain user previously added, such as plano; then click Check Names to search and complete the user name.
- Click OK.
- Repeat this process for each Windows server or machine.
14.3.3 Add and Configure the Agent for PowerShell
To add and configure an agent for PowerShell-based performance counter pollers, perform these tasks:
- Add an Agent
- Configure the Agent
Add an Agent
Before you can create and configure PowerShell-based performance counter pollers, you must add an agent for each remote Windows server or device from which you want to collect performance counter values.
Follow these steps to add an agent:
-
Navigate to Health > Elements.
The Elements window appears.
-
Click Agents to view a list of agents.
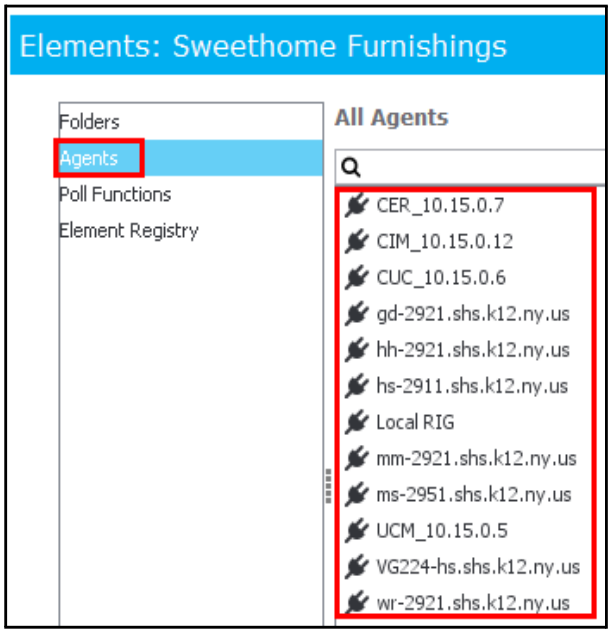
Figure 14-18 Elements - Agents
- Right-click in the All Agents pane and select Add.
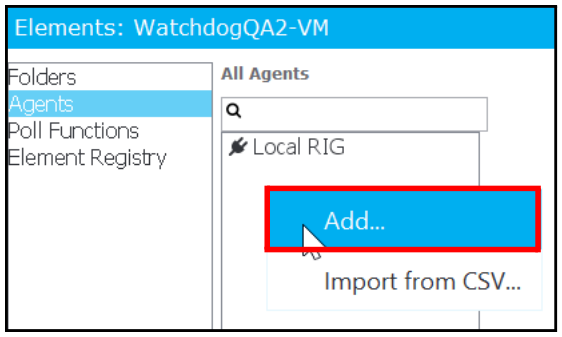
Figure 14-19 Select Add
The Add Agent window appears.
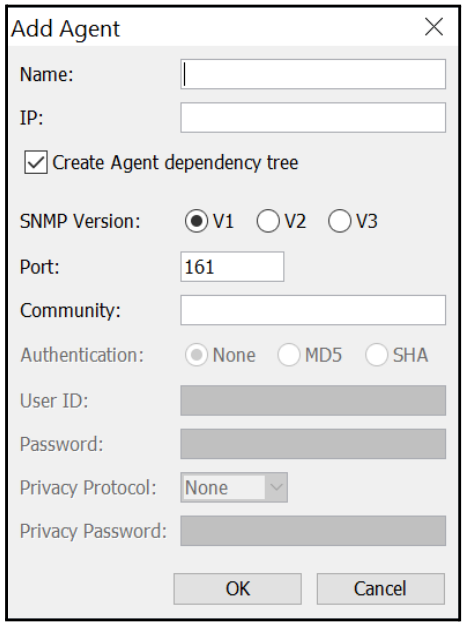
Figure 14-20 Add Agent
-
Enter the Name and IP address for the new agent; then click OK.
The new agent is added to the list of agents in the All Agents pane.
Note: You can also enter the following optional information for the new agent.
| Parameter | Description |
|---|---|
| Create Agent dependency tree | Select this option to create a dependency tree for the new agent. |
| SNMP Version | Select one of the following for the SNMP version: • V1 • V2 • V3 |
| Port | Enter the SNMP port, such 161. |
| Community | Enter the community string previously configured. |
| Authentication | Select one of the following authentications: • None • MD5 • SHA • SHA-256 • SHA-512 Note: Used only with SNMP V3. |
| User ID | Enter the user ID set up for the SNMP read only community string; must be 31 characters or less. Note: Used only with SNMP V3. |
| Password | Enter the password set up for the SNMP read only community string; must be 31 characters or less. |
| Privacy Protocol | Allows for encryption of SNMP V3 messages to ensure confidentiality of data. These protocols provide a higher level of security than is available in SNMP v1 and v2c, which use community strings for security. Both authentication and privacy are optional. Select one of the following privacy protocols: • None • DES • AES • AES-192 • AES-256 Note: Used only with SNMP V3. |
| Privacy Password | If you are using a privacy protocol, enter the associated password; must be 31 characters or less. |
Table 14-2 Add an Agent
Configure the Agent
After adding a new agent, you must edit the properties for the agent to add the PowerShell remoting properties.
Follow these steps to configure an agent:
-
Navigate to Health > Elements > Agents.
A list of agents appears.
-
In the All Agents panel, select the agent on which you are adding PowerShell remoting properties.
-
Right-click on the agent and select Edit.
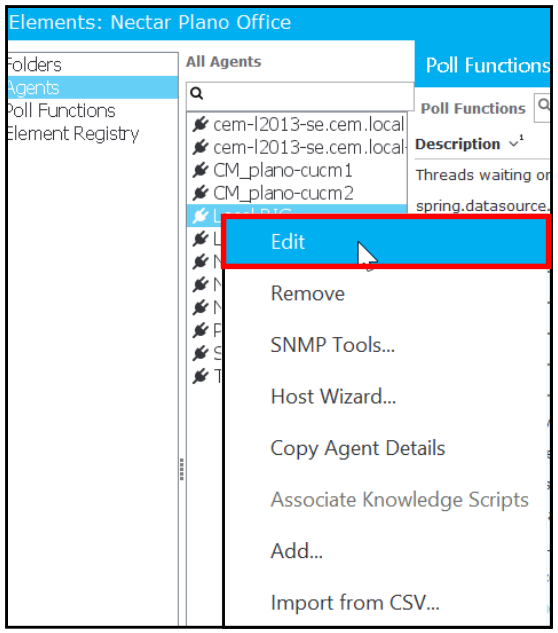
Figure 14-21 Edit
- In the Edit Agent window, select the Properties tab.
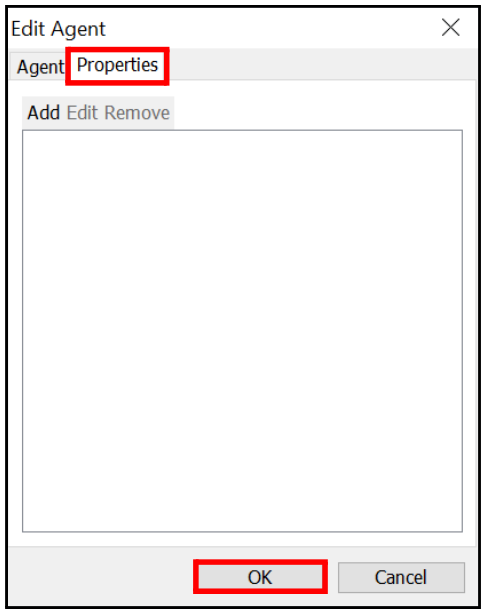
Figure 14-22 Edit Agent - Properties Tab
- In the Properties tab, click Add to display the Add Property window:
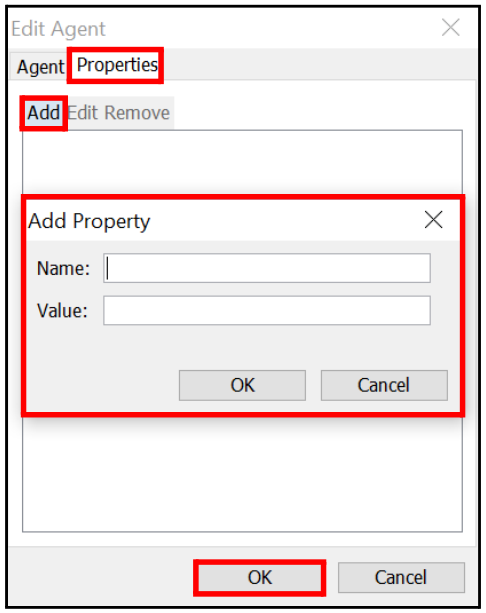
Figure 14-23 Add Property
- Add the following PowerShell properties by entering their Name (such as powershell.domain) and associated Value in the Add Properties window. This populates the Properties tab with their names and values.
Note: For this step, you will use the domain account information created in Create a New Domain Account in the Active Directory.
-
powershell.domain
-
powershell.host
-
powershell.password
-
powershell.user
For more information on adding a domain user, see Create a New Domain Account in the Active Directory.
When you have completed this step, your window will look like the following (this is an example only):
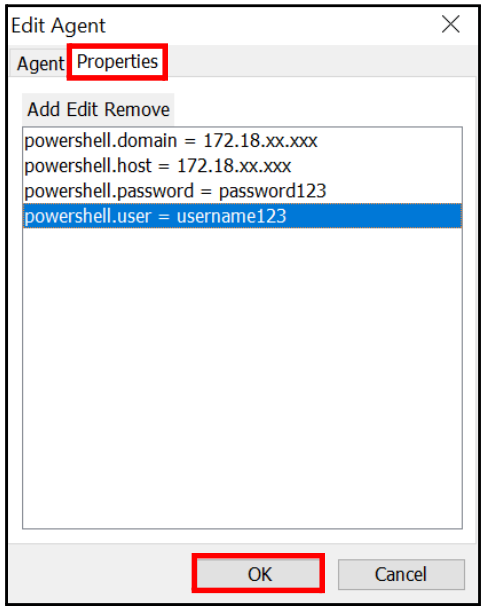
Figure 14-24 Powershell Properties - Examples
- When you have added all properties, click OK to close the Add Property window.
- Click OK to close the Edit Agent window.
14.3.4 Add the PowerShell-Based Performance Poll Functions
Nectar Foundation APM provides access to a number of poll function counters. We will discuss the following poll function counters in this section, as an example.
Follow these steps to enable or disable a poll function:
- Navigate to Health > Element.
- In the left pane, select Agents.
- In the All Agents pane, select the agent that you configured in Add and Configure the Agent for PowerShell.
- In the Poll Functions pane, right-click anywhere and select Add.

Figure 14-25 Add Poll Function
The Add Poll Function window appears.
In the next sections, we use this window to create a Windows Performance Counter Poller and Windows PowerShell Script Based Poller. See:
- Windows Performance Counter Poller
- Windows PowerShell Script Based Poller
Windows Performance Counter Poller
The Windows Performance Counter Poller communicates with the PowerShell-configured agent and obtains all of the available performance counters.
-
After clicking Add in Add the PowerShell-Based Performance Poll Functions:
a. Open the Other folder in the Add Poll Function window.
b. Select the Windows Performance Counter Poller (via PowerShell) option.
c. Click Next.
Note: You can enter a poller name (partial or complete) in the search field at the top to search for a particular poller.
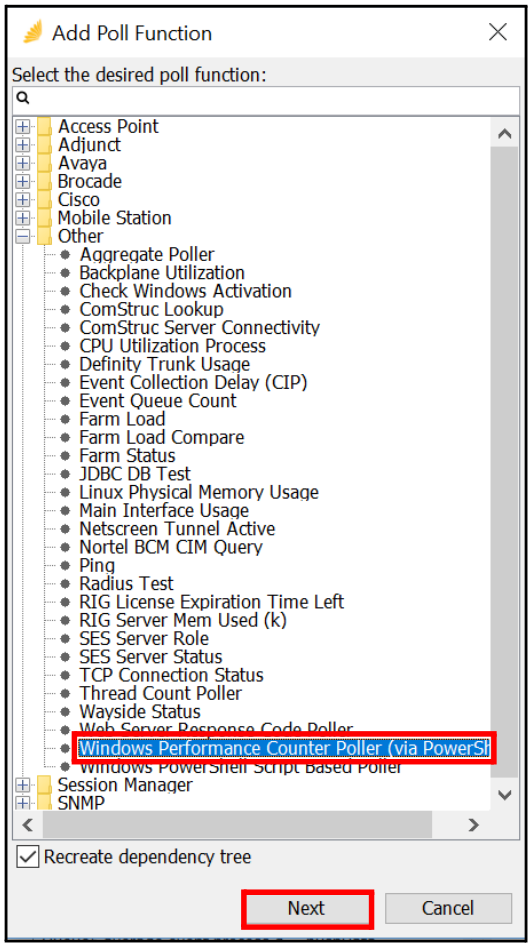
Figure 14-26 Add Poll Function
- In Parameters tab of the Add Windows Counter dialog, select a Windows Counter option, such as Memory Available Bytes.
- Click Add.
Note: You can use the Filter field to filter your results by entering a partial or complete parameter name.
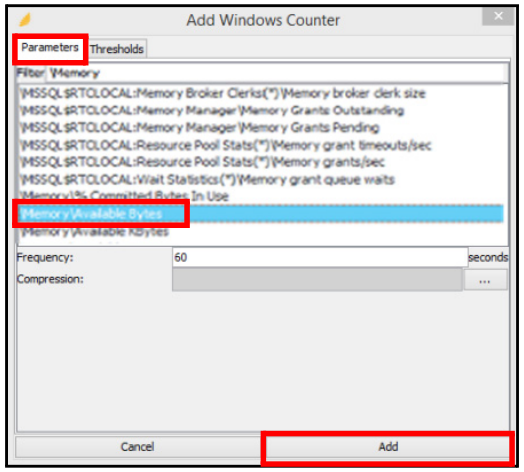
Figure 14-27 Memory Available Bytes
The Memory Available Bytes counter is added in the poll function list:

Figure 14-28 Memory Available Bytes
Windows PowerShell Script Based Poller
-
After clicking Add in Add the PowerShell-Based Performance Poll Functions:
a. Open the Other folder in the Add Poller Function window.
b. Select the Windows PowerShell Script Based Poller option.
c. Click Next.
Note: You can enter a poller name (partial or complete) in the search field at the top to search for a particular poller.

Figure 14-29 Add Poll Function
Note: In order for this to function correctly, make sure you have set up a Scripts folder. This is where you will place your PowerShell scripts that are displayed in this list.
Go to your Nectar server installation location.
Search for the apps/nectar/etc folder and locate the scripts folder. Create it, if it does not exist.
Note: In order for a PowerShell script to be made available in a poller, it must produce a single numeric output value.
A list of PowerShell scripts that are available on the server are displayed in the Add PowerShell Script Poller dialog:
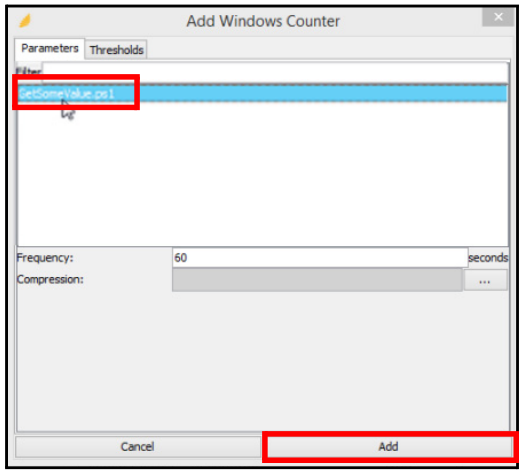
Figure 14-30 Add PowerShell Script Pollers
- Highlight a PowerShell script; then click Add.
- In the Poll Functions pane, you can view the poller and its functions that were created by the PowerShell script(s) you added:
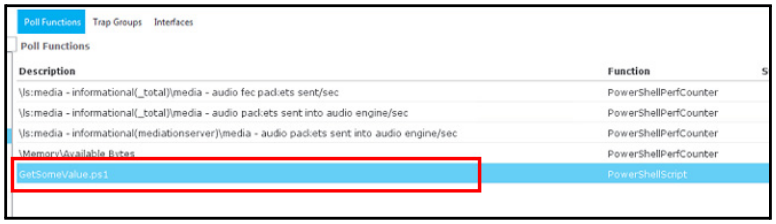
Figure 14-31 Added PowerShell Script
Multi-instance Counters
In the Parameters tab, multi-instance counters are indicated in the list by (*) in the name as follows:
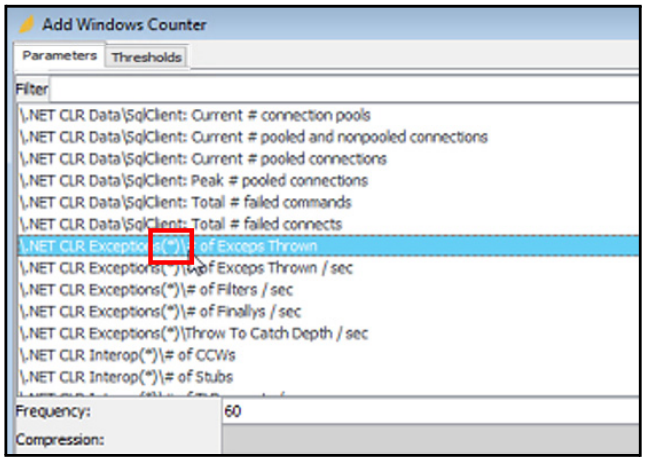
Figure 14-32 Multi-instance Counters
- Double-click on a multi-instance counter to view all of the counters within that multi-instance counter:
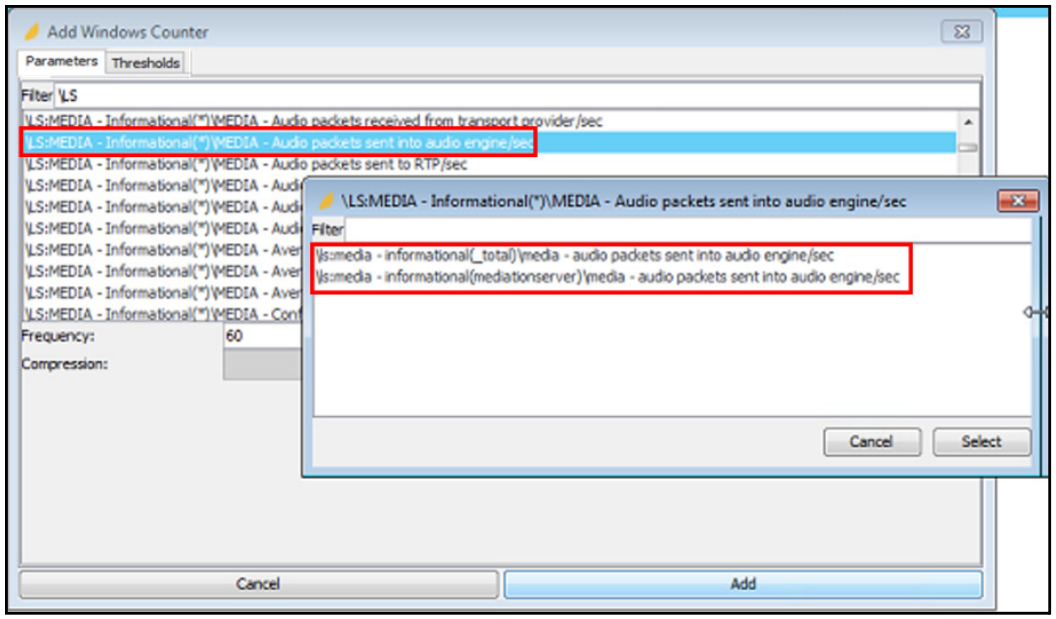
Figure 14-33 All Counters within a Multi-Instance Counter
- Highlight both of the counters and the Select button at the bottom of the window to create a poll function for these. The poll functions are displayed in the Poll Functions pane:

Figure 14-34 New Poll Functions
14.4 Enable or Disable Poll Functions
Follow these steps to enable or disable a poll function:
- Navigate to Health > Element > Poll Functions.
- Right-click on a poll function and select Enable or Disable.

Figure 14-35 Enable or Disable Poller Function
The poll function Enabled column shows true for enabled poll functions or false for disabled poll functions.
Figure 14-36 Poll Function True/False Status
14.5 Edit Poll Functions
Follow these steps to edit a poll function:
- Navigate to Health > Element > Poll Functions.
- Right-click on a poll function and select Edit.

Figure 14-37 Edit
The Edit Poll Functions - Parameters window appears.
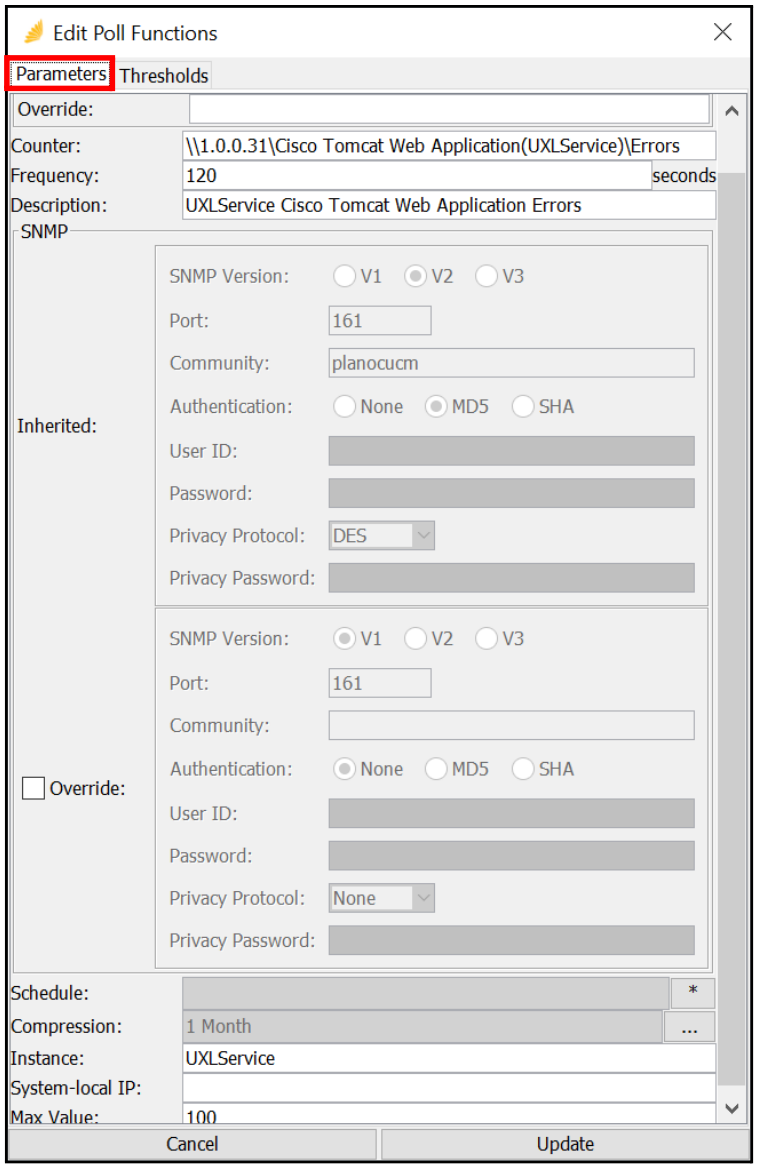
Figure 14-38 Edit Poll Functions
- On the Parameters tab, make changes to the values, as needed.
- Click the Thresholds tab; then click Add to add threshold values, as needed.

Figure 14-39 Threshold Tab
- Click Update.
14.6 Remove Poll Functions
Follow these steps to remove a poll function:
- Navigate to Health > Element > Poll Functions.
- Right-click on a poll function and select Remove:

Figure 14-40 Remove
The Remove Poll Functions? window appears.
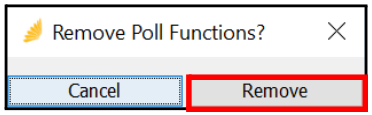
Figure 14-41 Remove Poll Functions?
- Click Remove.
14.7 Export Poll Functions
Follow these steps to export poll functions:
- Navigate to Health > Element > Poll Functions.
- Right-click on a poll function and select Export Poll Metrics.
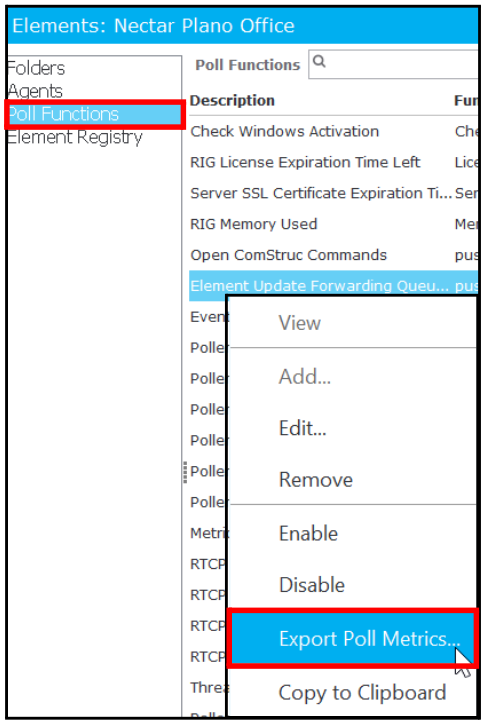
Figure 14-42 Export Poll Metrics
The Export Poller Metrics window appears.
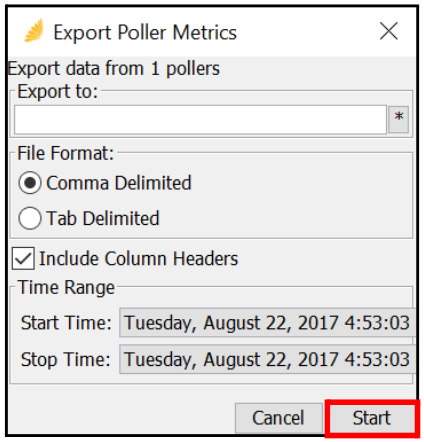
Figure 14-43 Export Poller Metrics
- Complete the following fields:
| Field | Description |
|---|---|
| Export to | Browse to the location on your computer where you will export the poller function to. |
| File Format | Select the file format: • Comma delimited • Tab delimited |
| Include Column Headers | Select this to include column headers in the file. |
| Time Range | Enter a time range: • Start Time • End Time |
Table 14-3 Poll Function Export
- Click Start to begin th export.
15. Configure Network Monitors
The RIG is able to collect metrics for various processes, and these are managed in the Elements module and viewed in the Dashboard module.
This section explains how to:
- Overview
- Manage Agents
- Run SNMP Tools
- Run Host Wizard
- View Statistical Collections and Performance Data
- Manage Thresholds
- View Polling Metric Chart
- Manage Interfaces
15.1 Overview
The Element system contains a grouping function called Agents for all collections to be performed against a target device. You can define an agent and associate all interrogation requests for that target with the agent, such as SNMP, ICMP, and other available types.
There are also different collections leveraged for various equipment types. As additional agents are added, they are also re-ordered numerically first, then alphabetically.
To access Agents, navigate to Health > Element.
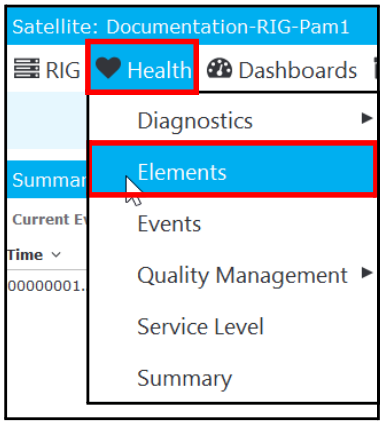
Figure 15-1 Health > Elements
When the Elements window appears, select Agents in this list.
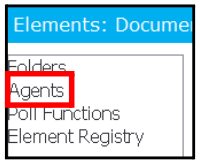
Figure 15-2 Elements
To access polling, select an agent in the All Agents list and view the poll functions.
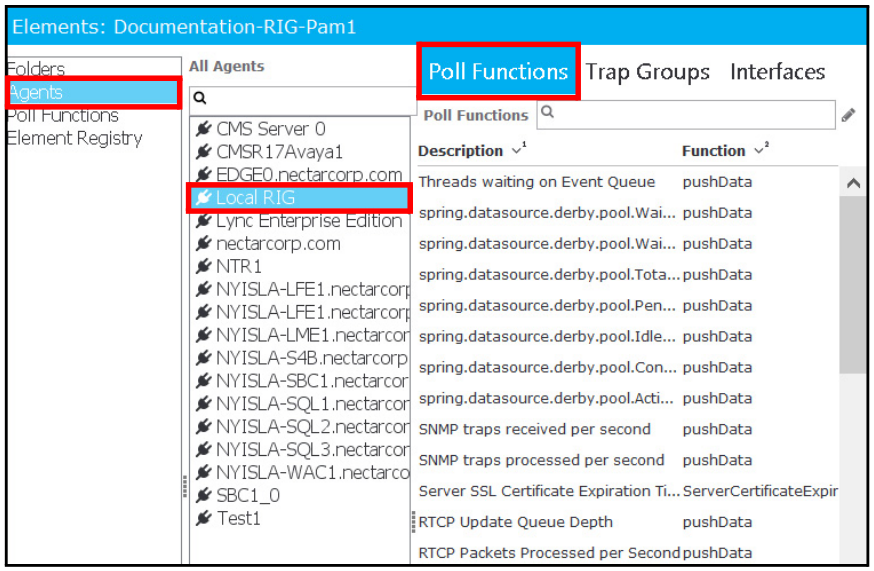
Figure 15-3 Poll Functions
Different statistics can also be collected at distinctive intervals to ensure smooth and unified polling, while maintaining the appropriate performance data sets for different measurements. If a poll function is configured to store the metric data, then the data can be viewed in chart form by double-clicking the poll function entry.
Nectar Foundation APM incorporates several standard event and performance management functions found in a variety of commercial solutions available today. Many unique features in the form of distribution and remote monitoring and management enhance Nectar Foundation APM’s ability to scale past standard commercial packages when deployed for Service Providers.
15.2 Manage Agents
This section explains how to manage agents, including:
- Add a New Agent
- Edit an Agent
- Remove an Agent
15.2.1 Add a New Agent
Note: The Import from CSV option allows you to import multiple agents and their properties.
Follow these steps to add a new agent:
-
Navigate to Health > Element > Agents.
A list of agents appears.

Figure 15-4 Add Agent
-
Right-click in the All Agents panel and click Add.
The Add Agent window appears.
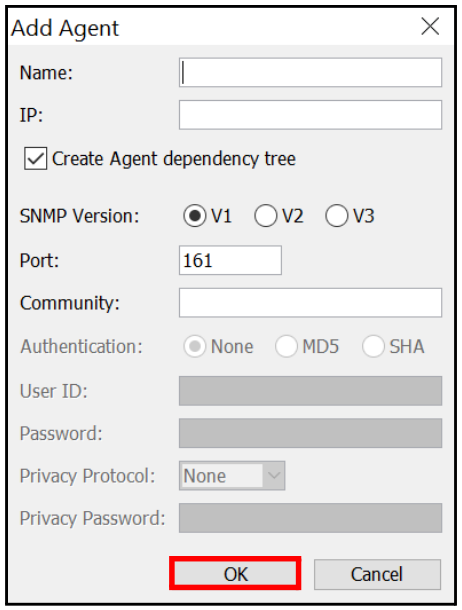
Figure 15-5 Add Agent
- Complete the following fields:
| Field | Description |
|---|---|
| Name | Enter the name of the new agent. |
| IP | Enter the IP address of the localhost. |
| Create Agent dependency tree | Select to create a dependency tree for the new agent. For more information, see Dependency Tree Management. |
| SNMP Version | Select the SNMP version from one of the following: • V1 • V2 • V3 |
| Port | Enter the SNMP port, such as 161. |
| Community | Enter the community string previously configured. |
| Authentication | Select the authentication from one of the following: • None • MD5 • SHA • SHA-256 • SHA-512 Note: Enabled for SNMP V3 only. |
| User ID | Enter the User ID previously set up for the SNMP V3 read only credentials; must be 31 characters or less. Note: Enabled for SNMP V3 only. |
| Password | Enter the password previously set up for the SNMP V3 read only credentials; must be 31 characters or less. Note: Enabled for SNMP V3 only. |
| Privacy Protocol | Select the protocol from one of the following: • None • DES • AES • AES-192 • AES-256 Note: Enabled for SNMP V3 only. |
| Privacy Password | Enter the password for the Privacy Protocol; must be 31 characters or less. Note: Enabled for SNMP V3 only. |
Table 15-1 Add Agent
-
Click OK.
The new agent is added to the list of agents in the All Agents pane.
15.2.2 Edit an Agent
Follow these steps to edit an agent:
-
Navigate to Health > Element > Agents.
A list of agents appears.

Figure 15-6 Edit Agent
-
Right-click on an agent and select Edit.
The Edit Agent window appears.
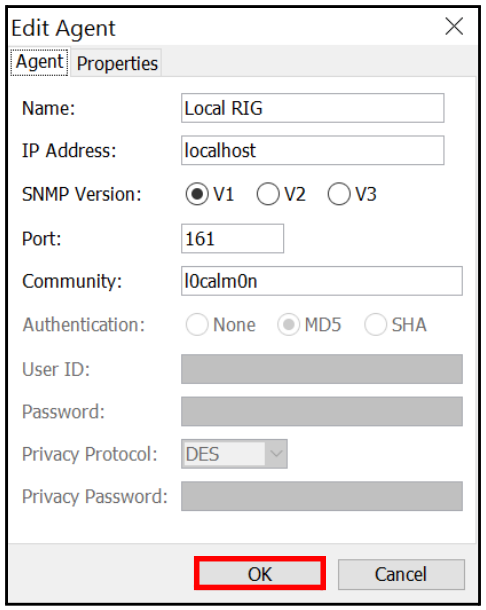
Figure 15-7 Edit Agent
-
Make changes, as needed; then click OK.
The agent is updated with new data.
15.2.3 Remove an Agent
Follow these steps to remove an agent:
-
Navigate to Health > Element > Agents.
A list of agents appears.
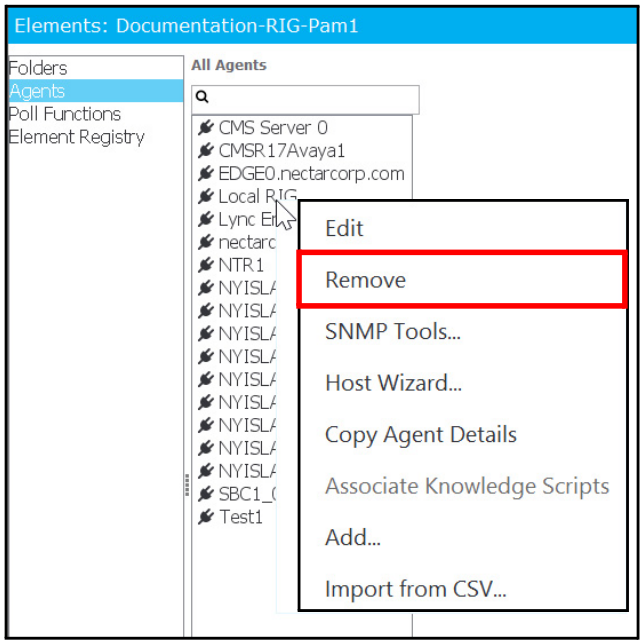
Figure 15-8 Remove Agent
-
Right-click on an agent and select Remove.
The Remove Elements dialog box appears with the following message:
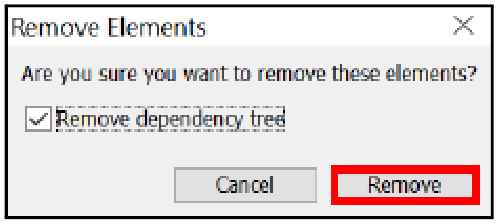
Figure 15-9 Remove Elements
-
Click Remove.
The agent is removed from the list of agents in the All Agents pane.
15.3 Run SNMP Tools
After an agent is created, a wizard identifies available objects to be monitored.
Follow these steps to run the SNMP Tools:
-
Navigate to Health > Element > Agents.
A list of agents appears.
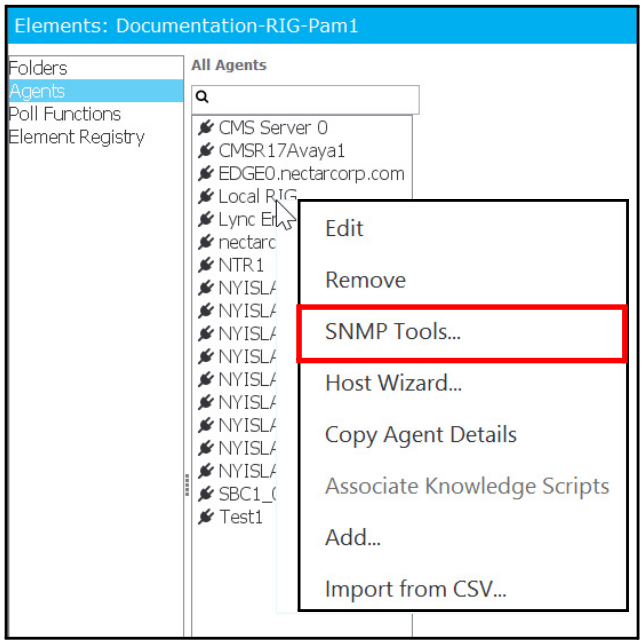
Figure 15-10 SNMP Tools
-
Right-click on an agent and select SNMP Tools.
The SNMP window appears.
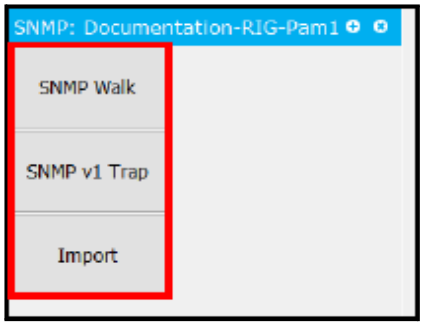
Figure 15-11 SNMP Tools
- Select one of the following three SNMP tools:
| Tool | Description |
|---|---|
| SNMP Walk | This is a generic walk tool that lets the user test devices to see if they will respond to a basic SNMP Walk. |
| SNMP v1 Trap | This enables the user to send a sample SNMP to some other management tool, system, or RIG. |
| Import SNMP MIB | This gives the user the ability to import an SNMP MIB in order to create custom pollers and packs. |
Table 15-2 SNMP Tools
15.3.1 SNMP Walk
When you decide that you want to write an SNMP monitoring application for a given device you need to start by understanding what is available to you. You can use the SNMP Walk tool to do this.
-
Click the SNMP Walk button.
The SNMP Walk window appears to the right.
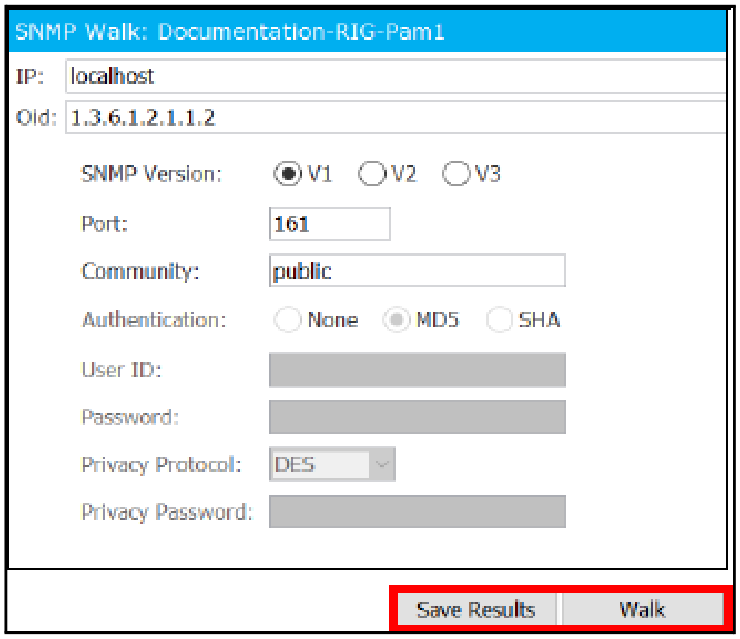
Figure 15-12 SNMP Walk
- Complete the following fields:
| Field | Description |
|---|---|
| IP | Enter the IP address of the local host. |
| Old | Enter the OId (Object Identifier) |
| SNMP Version | Select the SNMP version from one of the following: • V1 • V2 • V3 |
| Port | Enter the SNMP port, such as 161. |
| Community | Enter the community string previously configured. |
| Authentication | Select the authentication from one of the following: • None • MD5 • SHA • SHA-256 • SHA-512 NOTE: Enabled for SNMP V3 only |
| User ID | Enter the User ID previously set up for the SNMP V3 read only credentials; must be 31 characters or less. NOTE: Enabled for SNMP V3 only. |
| Password | Enter the password previously set up for the SNMP V3 read only credentials; must be 31 characters or less. NOTE: Enabled for SNMP V3 only. |
| Privacy Protocol | Select the protocol from one of the following: • None • DES • AES • AES-192 • AES-256 NOTE: Enabled for SNMP V3 only. |
| Privacy Password | Enter the password for the Privacy Protocol; must be 31 characters or less. NOTE: Enabled for SNMP V3 only. |
| Walk | Click this button to begin the SNMP walk. |
| Save Results | Click this button to save the SNMP walk results. |
Table 15-3 SNMP Walk
- Click one of the following:
| Button | Click to ... |
|---|---|
| Walk | Begin the SNMP walk. You will receive a return value. |
| Save Results | Open the Save dialog box to save the SNMP walk results. |
Table 15-4 Buttons
15.3.2 SNMP v1 Trap
SNMP v1 Trap messages are alerts generated by agents on a managed device.
Follow these steps to send an SNMP v1 Trap message from the agent:
- Click the SNMP v1 Trap button.
- The SNMP v1 Trap window appears to the right.
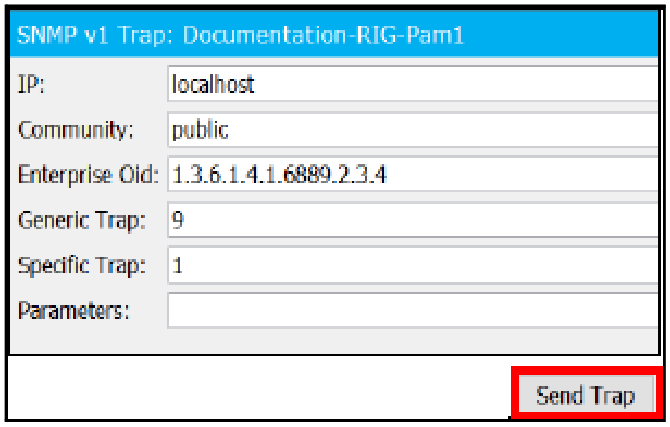
Figure 15-13 SNMP v1 Trap
- Complete the following fields:
| Field | Description |
|---|---|
| IP | Enter the IP address of the localhost. |
| Community | Enter the community string, such as snmpR. |
| Enterprise OId | Enter the Enterprise OId (Object Identifier). |
| Generic Trap | Enter the generic Trap value. |
| Specific Trap | Enter the specific Trap value |
| Parameters | Enter any SNMP v1 Trap parameters for this message. |
Table 15-5 SNMP v1
- Click Send Trap to send the SNMP v1 trap message.
15.3.3 Import SNMP MIB
You can import an SNMP MIB file to create custom pollers and packs:
-
Click the Import button.
The Open dialog box appears.
-
Browse to the location of the SNMP MIB file that you want to import.
Note: The file must be a Vendor Enterprise (.MIB) file.
-
Select the file; then click Open.
The SNMP Import window appears with a list of the OId (Object Identifiers) for the selected MIB appears.
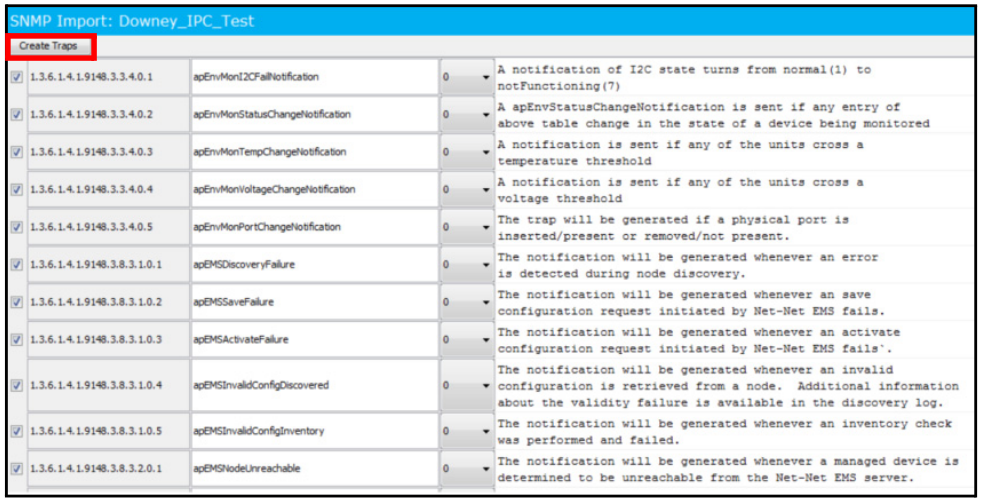
Figure 15-14 SNMP Import - Create Traps
-
Select the desired Traps; then click Create Traps.
This sends the Trap definition to the Nectar Foundation APM Trap Receiver.
-
After making your selections, click Next to view the SNMP Import - Create Pollers window.

Figure 15-15 SNMP Import - Create Pollers
-
Select the desired pollers.
-
Select the Gauge or Counter option using the drop-down; then click Create Pollers.
This adds the corresponding pollers to the Adjunct Pollers list for each agent.
-
Click Next to view a list of created pollers.
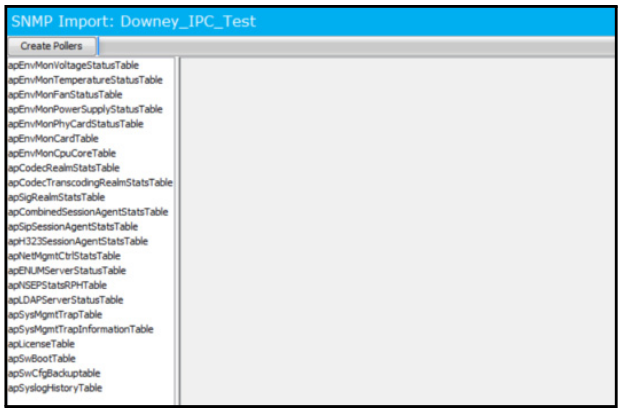
Figure 15-16 Import MIB
15.4 Run Host Wizard
After adding an agent, you can use the Host Wizard to create pollers to gather data for the agent. The Host Wizard helps you identify available objects to be monitored.
Follow these steps to run the Host Agent wizard:
-
Navigate to Health > Element > Agents.
A list of agents appears.
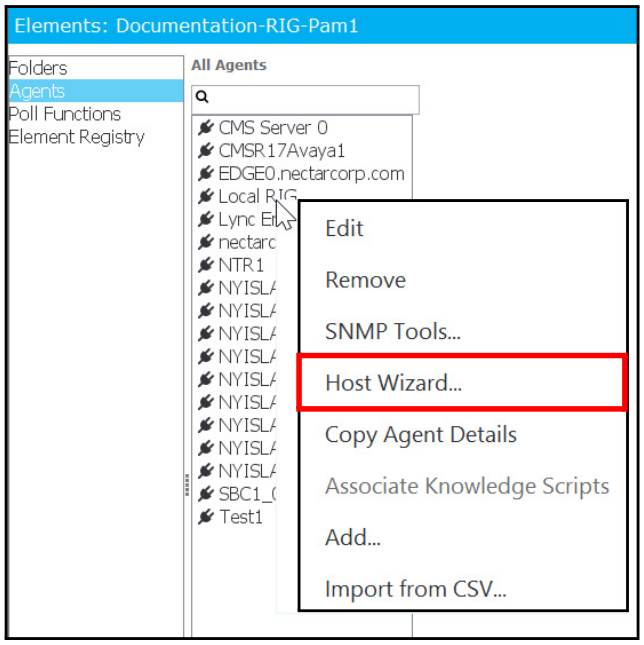
*Figure 15-17 *
-
Right-click on an agent and select Host Wizard.
The Host Wizard - Create Pollers for Agent Resources window appears.
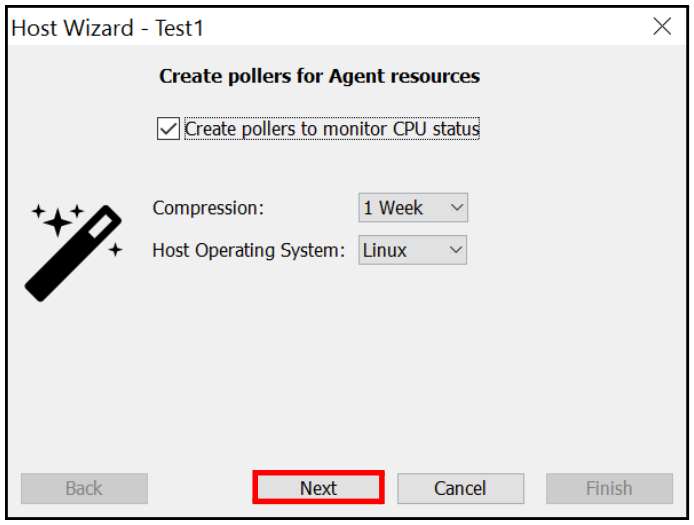
Figure 15-18 Host Wizard
- Complete the following; then click Next:
| Field | Description |
|---|---|
| Create pollers to monitor CPU status | Select this check box to create pollers with this host wizard that monitors your CPU status. |
| Compression | Select a time period for data retention using the drop- down: • 1 Week • 2 Weeks • 1 Month • 3 Months For more information, see Edit Compression. |
| Host Operating System | Select the host operating system using the drop-down: • Linux • OS X • Windows • Solaris |
Table 15-6 Host Wizard
Note: The operating system is automatically detected by the RIG according to the file system formatting and process/service list returned from the host.
The Host Wizard - Disks/Memory window appears.
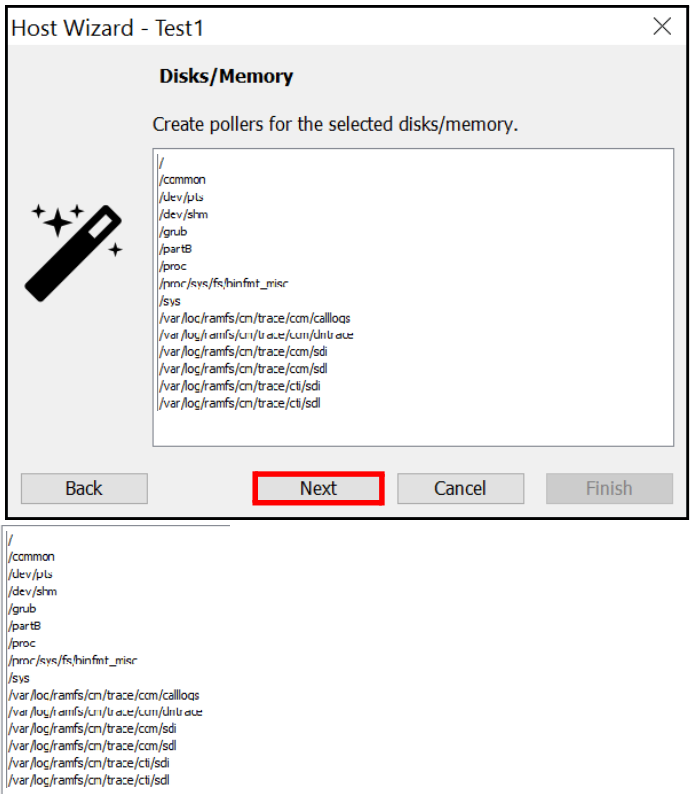
Figure 15-19 Host Wizard - Disks/Memory
- Select the disks/memory for which you will create pollers; then click Next.
Note: You can select more than one option using the Ctrl key.
The Host Wizard - Services window appears.
Note: When Windows is selected as the Host Operating System in the Host Wizard - Create Pollers for Agent Resources page, the Host Wizard - Services window appears. When any other operating system is selected, the Host Wizard - Processes window appears, where you can select processes instead of services.
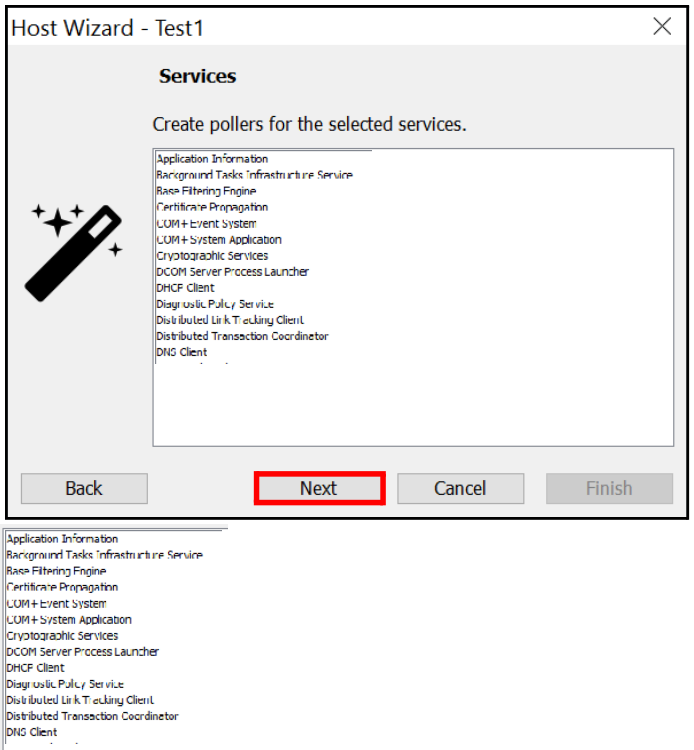
Figure 15-20 Host Wizard - Services
- Select the services for which you will create pollers; then click Next.
Note: You can select more than one option using the Ctrl key.
The Host Wizard - Layer 3 Status (Ping) window appears.

Figure 15-21 Host Wizard - Layer 3 Status (Ping)
- Select the Layer 3 status ping entries for which you will create pollers; then click Next.
Note: You can select more than one option using the Ctrl key.
The Host Wizard - Layer 2 status page appears.
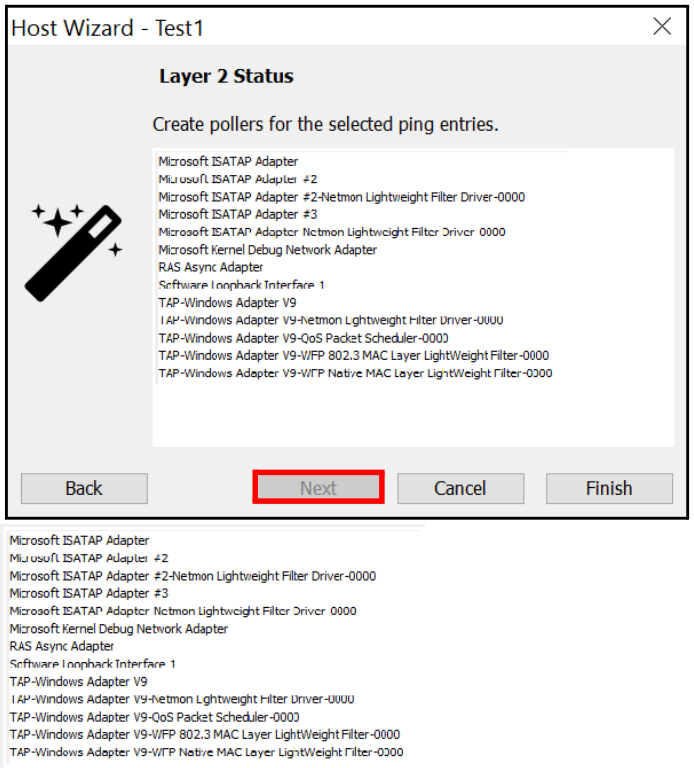
Figure 15-22 Host Wizard - Layer 2 Status
- Select the Layer 2 Status ping entries for which you will create pollers.
Note: You can select more than one option using the Ctrl key.
-
Click Finish.
Pollers are now created according to your selections.
15.5 View Statistical Collections and Performance Data
Nectar Foundation APM employs normalization tactics to reduce the reliance of vendor or technology specific context. This allows for a Service Provider to increase the ability for lower responder tiers to make decisions and employ resolutions more easily, because information is presented in the context of the collection.
In addition to normalization, Nectar Foundation APM also allows for instant replay into history of real-time monitor views of any statistical collections. The operator can establish collection frequency and retention standards within the platform by customer, location, class of device, or individual elements. These capabilities aid both operators and customers, so information can be viewed in the context of capacity and capabilities.
For information on managing poll functions (which are used in this section), see Manage Poll Functions.
15.5.1 Example: Parameters - Ping
The following example tests whether a particular host is reachable across an IP network.
- Navigate to Health > Elements.

Figure 15-23 Health > Elements
- Click Folders.
- Select a Root Folder.
- Select Infrastructure.
- Select a Poll Function.
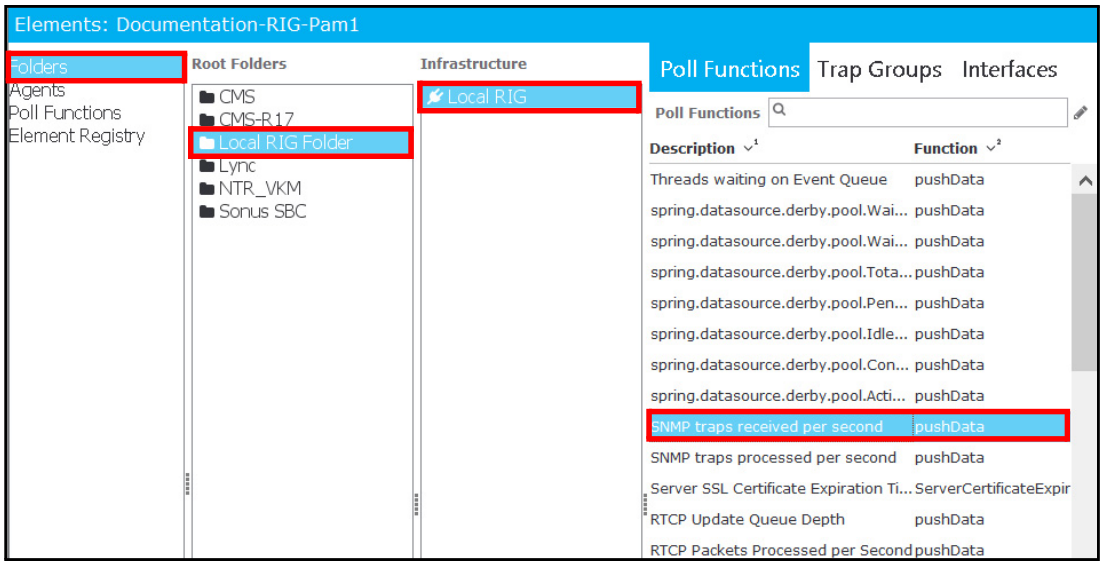
Figure 15-24 Folders > Root Folder > Infrastructure > Poll Function
- Right-click on a Poll Function and click Add in the menu.

Figure 15-25 Add Poll Function
The Add Poll Function window appears.

Figure 15-26 Add Poll Function
- Enter Ping in the Search field; then select Ping and click Next.
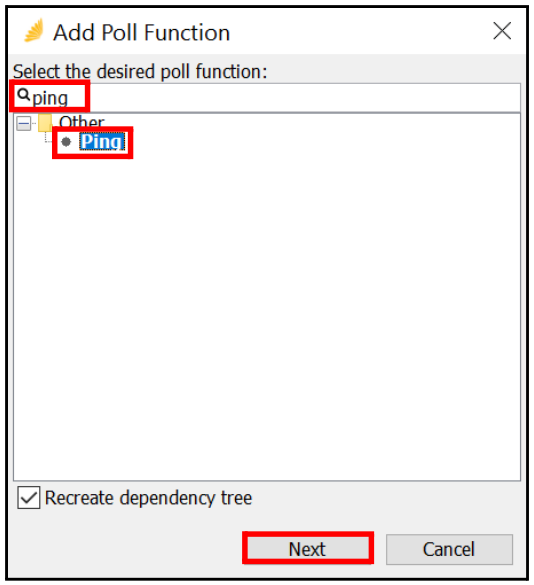
Figure 15-27 Add Poller Function - Select Ping
The Parameters tab appears.
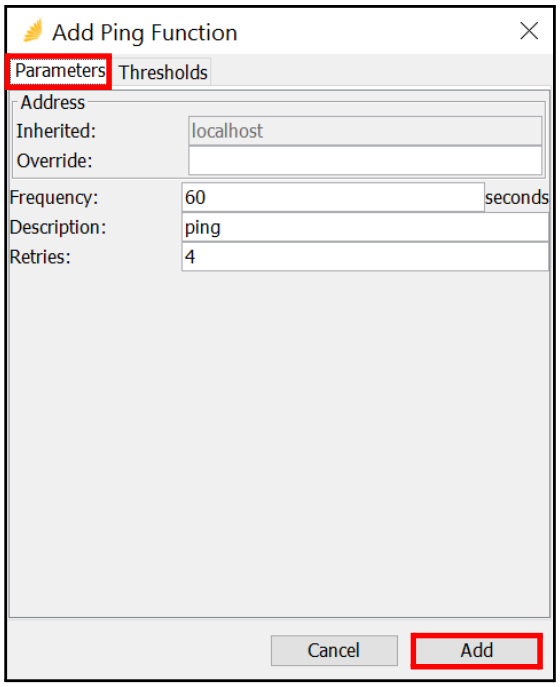
Figure 15-28 Add Ping Function - Parameters Tab
- Enter the following; then click Add.
| Field | Description |
|---|---|
| Address | |
| Inherited | • Enter the inherited address for the agent. • Accept the default or enter an Override. |
| Override | Enter a new address for a unique instance when a different address needs to be supplied. |
| Frequency (secs.) | • Enter how often the poller runs. • Default is 60 seconds. |
| Description | Defaults to the selected poll function name. |
| Retries | Enter the number of retries for the poll function. |
Table 15-7 Add Ping Function
You can click the Thresholds tab and modify the thresholds of any poll function.
- Some poll functions, such as the Ping function, automatically have associated thresholds.
- You can choose to have the poll function generate an event based on the results of the task.
- Each poll function returns a number as a result of its task. For example, the Ping poll function returns 1, if the destination is reachable, and -1, if the destination does not reply.
- Usage monitors return the current utilization of the network element they are sampling.
15.5.2 Example: Parameters - CPU Utilization Process
The following example tests CPU Utilization Process.
-
Follow steps 1-6 in Example: Parameters - Ping.
The Add Poll Function window appears.

Figure 15-29 Add Poll Function
- Enter CPU Utilization Process in the Search field; then select CPU Utilization Process and click Next.

Figure 15-30 Add Poller Function - Select Ping
The Parameters tab appears.

Figure 15-31 Add CPU Utilization Process
- Enter the following information; then click Add.
| Field | Description |
|---|---|
| Address | |
| Inherited | • Enter the address for the agent. • Accept the inherited default or enter an Override. |
| Override | Enter a new address for a unique instance when a different address needs to be supplied. |
| SNMP | Select from the following: • Inherited - If selected, the default values are used; pulls pre- defined data from the agent. • Override - If selected, enter new values for SNMP. |
| SNMP Version | Select the SNMP version from one of the following: • V1 • V2 • V3 |
| Port | Enter the SNMP port, such as 161. |
| Community | Enter the community string previously configured. |
| Authentication | Select the authentication from one of the following: • None • MD5 • SHA • SHA-256 • SHA-512 Note: Enabled for SNMP V3 only. |
| User ID | Enter the User ID previously set up for the SNMP V3 read only credentials; must be 31 characters or less. Note: Enabled for SNMP V3 only. |
| Password | Enter the password previously set up for the SNMP V3 read only credentials; must be 31 characters or less. Note: Enabled for SNMP V3 only. |
| Privacy Protocol | Select the protocol from one of the following: • None • DES • AES • AES-192 • AES-256 Note: Enabled for SNMP V3 only. |
| Privacy Password | Enter the password for the Privacy Protocol; must be 31 characters or less. Note: Enabled for SNMP V3 only. |
| Walk | Click this button to begin the SNMP walk. |
| Save Results | Click this button to save the SNMP walk results. |
| Frequency | • Enter how often the poller runs. • Default is 60 seconds. |
| Process Name | Enter the process name or click * to select a process name. |
| Description | Defaults to the selected poll function name. |
| Compression | • Informs the server how long to hold onto the metric data. • Click ... to edit compressions and associated strategy legs. For more information, see Edit Compression. • If the Compression field is left undefined, then chart data will not be associated with the poller. It continues to get metric data, but will not store it historically. |
Table 15-8 CPU Utilization Parameters
- Click Add to commit the data.
Edit Compression
Follow these steps to select a different compression:
-
Click ... to the right of the Compression field.
The Edit Compression window appears. The default is set as [Do Not Store].
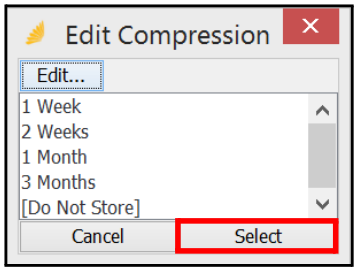
Figure 15-32 Edit Compression
- Select one of the following compression strategies, such as 1 Week; then click Select.
-
1 Week
-
2 Weeks
-
1 Month
-
3 Months
The Parameters tab appears with the new compression.
-
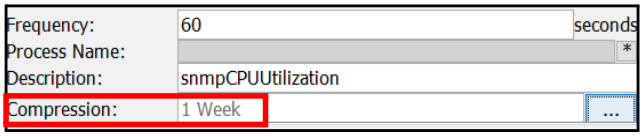
Figure 15-33 New Compression
View Compression Strategies
Follow these steps to view the available compression strategies:
- From the Edit Compression window, click Edit.

Figure 15-34 Click Edit
The Edit Compression Strategies window appears.
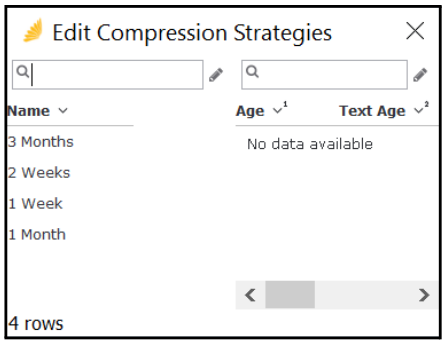
Figure 15-35 Edit Compression Strategy
When you select a compression strategy on the left, such as 3 Months, you can view the compression rules for that strategy to the right. These are also called Strategy Legs.

Figure 15-36 Edit Compression Strategies
3 Months
This strategy stores three months of data:
- After one week (7 days), average data to five-minute clusters.
- After one month (30 Days) average data to one hour clusters.
- After three months (90 days) delete the data.
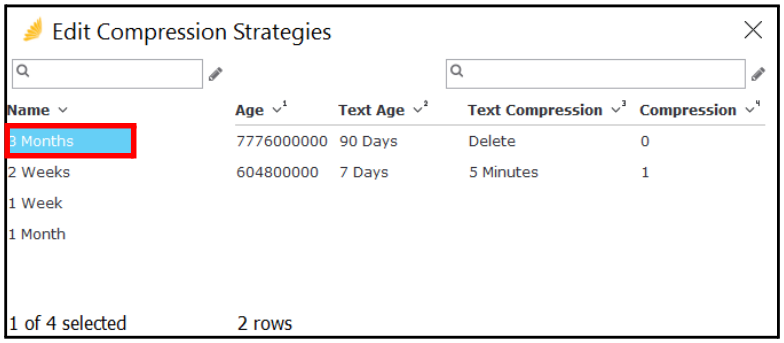
Figure 15-37 Example - 3 Months
Note: Storing data over one month creates limitations on data storage. Be sure to set up the appropriate compression strategies.
2 Weeks
This strategy has two legs and instructs to keep the data for 14 days with the following rules:
- After one week, compress the data to 5 minutes.
- After two weeks, delete the data.

Figure 15-38 Example - 2 Weeks
1 Week
This strategy has one leg that instructs to keep the data for seven days; then delete.
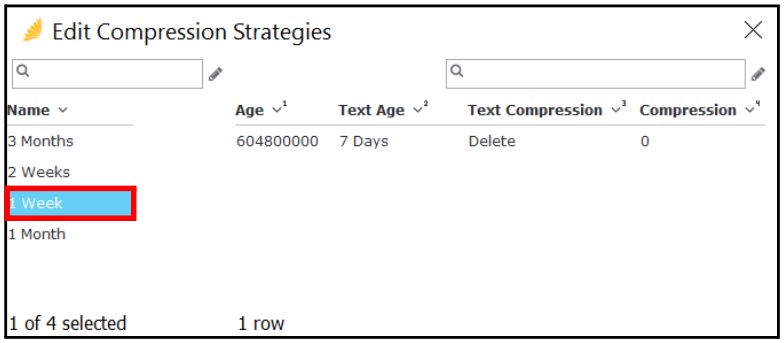
Figure 15-39 Example - 1 Week
1 Month
This strategy has two legs and instructs to keep the data for 30 days with the following rules:
- After one week, compress the data to 5 minutes.
- After one month, delete the data.
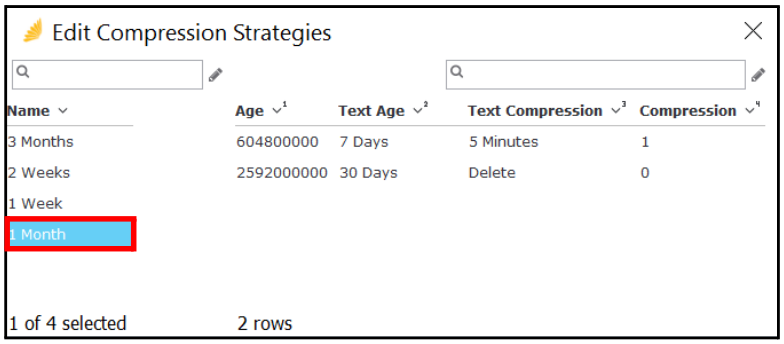
Figure 15-40 Example - 1 Month
Modify a Compression Strategy
You can edit a compression strategy by adding or removing the strategy legs.
Follow these steps to edit a compression strategy:
- From the Edit Compression Strategies window, select a strategy.
- Right-click in the Strategy Leg area (see Figure 15-41)and select New Strategy Leg from the menu.
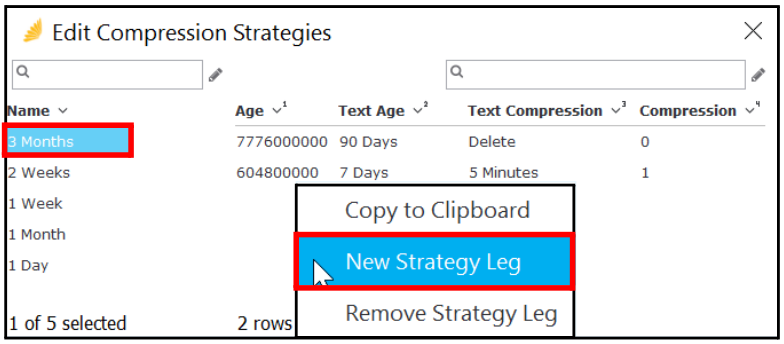
Figure 15-41 New Strategy Leg
The Add Compress Function window appears.
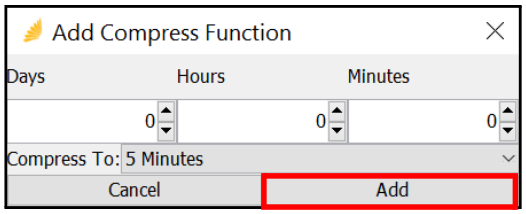
Figure 15-42 Add Compress Function
-
Select the up and down arrows to the right of each field or manually enter the Days, Hours, and Minutes for the new strategy leg.
-
Define the Compress To time allotment using the drop-down.
-
Click Add.
The new strategy leg is displayed for the compression strategy.
-
Close the window by selecting the X in the upper right corner of the window.
The Edit Compression window re-appears.
-
Highlight the strategy; then click Select.
-
Close the Edit Compression window.
The Parameters tab appears.
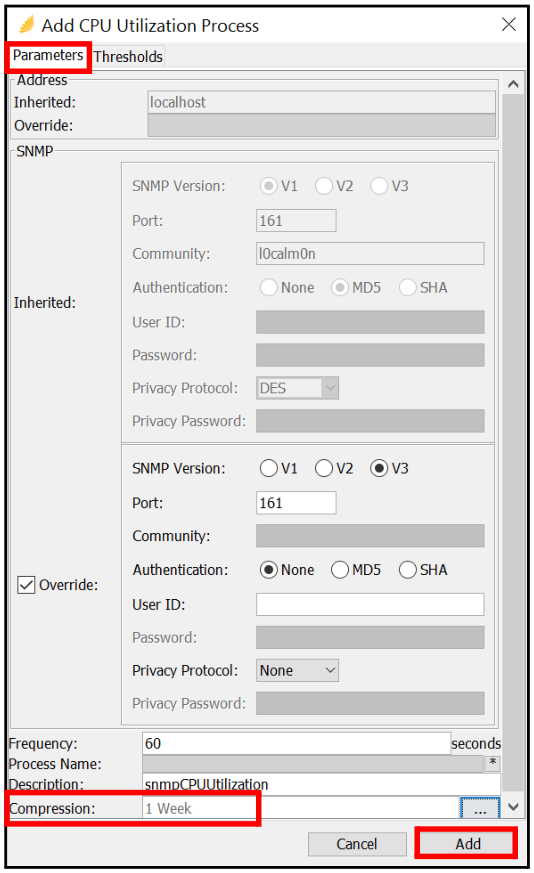
Figure 15-43 New Compression
- Confirm that the new strategy is displayed in the Compression field.
- Click Add to complete the process.
Remove a Strategy Leg
Follow these steps to remove a strategy leg from a compression strategy:
- From the Edit Compression Strategies window, select the compression strategy you want to modify in the Name column on the left; then view the strategy legs for that strategy on the right.
- Select the strategy leg that you want to remove.
- Right-click and select Remove Strategy Leg to delete the rule/condition from the compression strategy.
Remove a Compression Strategy
Follow these steps to remove a compression strategy listed in the Name column:
-
From the Edit Compression Strategies window, select the strategy in the Name column to remove.
-
Right-click and select Remove Compression Strategy.
The compression strategy is removed from the list of compression strategies.
15.6 Manage Thresholds
Thresholds are set to trigger events when certain instances occur. When metric data enters the system, it looks to match a threshold rule.
For example:
- When disk usage is greater than 90 percent, it is deemed a level 5 (red) alert.
- When the disk usage is greater than 60 percent, it ranks as a Level 3 (orange) alert.
- When the disk usage is greater than 30 percent, the alert is Level 2 (yellow).
- When the disk usage is always -1, it is deemed a Level 1 (green) alert.
This section explains how to manage thresholds, including:
- View Thresholds
- Add a Threshold
- Apply Bulk Edits
15.6.1 View Thresholds
Follow these steps to view thresholds:
- Navigate to Health > Element.
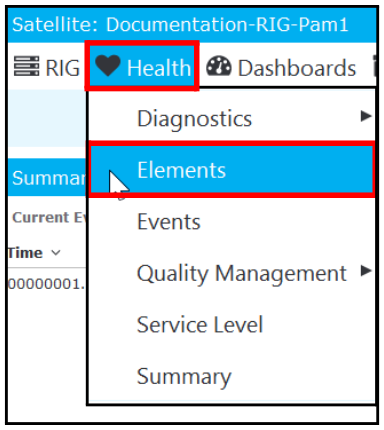
Figure 15-44 Health > Elements
The Elements window appears.

Figure 15-45 Elements > Poll Functions
- Click Poll Functions to view a list of poll functions.
- Select a Poll Function; then right-click and select Edit from the menu.
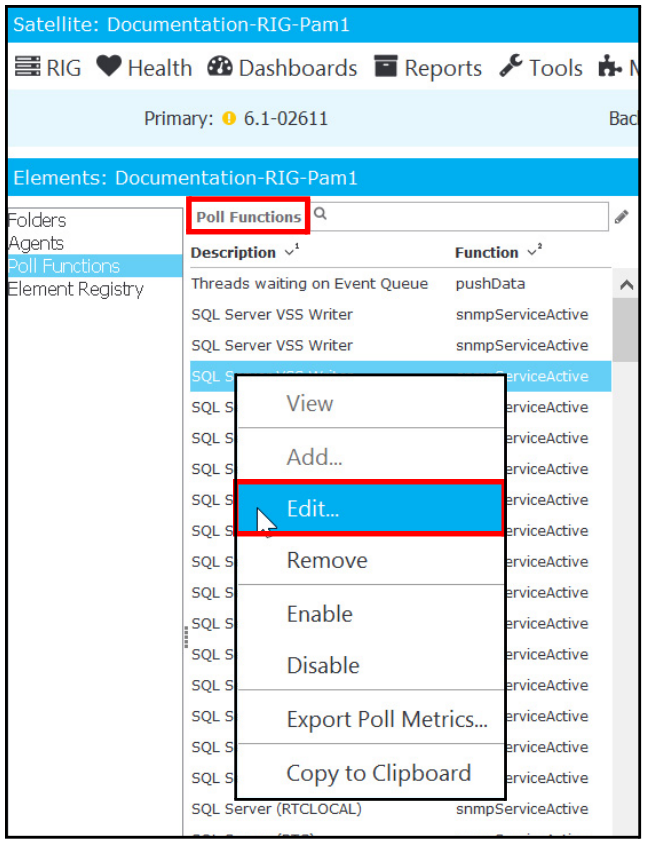
Figure 15-46 Edit Poll Function
The Edit Poll Functions window appears.
- Click the Thresholds tab.
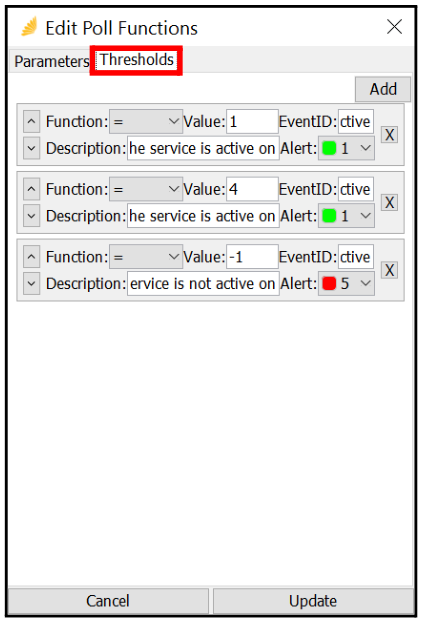
Figure 15-47 Thresholds Tab
- View the current thresholds for the poll function.
15.6.2 Add a Threshold
Follow these steps to add a new threshold:
- Click Add.
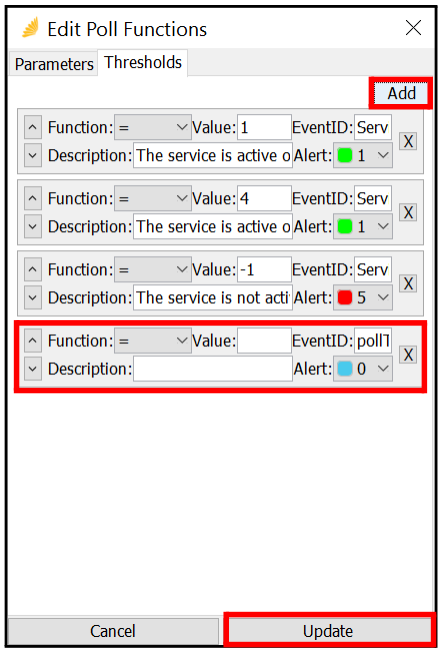
Figure 15-48 Add Threshold
- Enter the following information; then select Update:
| Field | Description |
|---|---|
| Function | Select a matching function using the drop-down: • =: Poll task return equals the given value. • !=: Poll task return does not equal the given value. • >: Poll task return is greater than the given value. • <: Poll task return is less than the given value. • Always: Threshold entry always matches. • %>: Percentage of the poll task return is calculated using the maxValue for the poll function. If the percentage is greater than the given value, then the entry matches. • %<: Percentage of the poll task return is calculated using the maxValue for the poll function. If the percentage is less than the given value, then the entry matches. |
| Value | Numerical amount used with Function to trigger an event. |
| EventID | • Type of event that will be declared for this threshold. • There is no preset value for this field. • Enter a unique identifier for this event. • Identifier can be used in multiple pollers, if the results for their occurrence are the same. |
| Description | Enter a brief summary of the threshold. |
| Alert | Select the numerical color that identifies the importance of this alarm. |
 |
Select to move the threshold up or down in order. |
Table 15-9 Add Thresholds
15.6.3 Apply Bulk Edits
Bulk edits can be made to both Parameters and Thresholds by selecting more than one poll function:

Figure 15-49 Select Multiple Poll Functions
- To use bulk edit, use one of the following to select multiple poll functions:
| Field | Description |
|---|---|
| Multiple | Hold down the Shift key and select the first poll function; then select the last poll function to select all poll functions in between. |
| Non-Contiguous | Hold down the Ctrl key and randomly select poll function(s) in the list. |
Table 15-10 Bulk Edits
- With your selections highlighted, right-click and select Edit (as discussed earlier in this section).
Note: Changes committed using bulk edits will permanently adjust ALL selected poll functions.
The Edit Poll Functions - Parameters window appears (similar to the following) for a bulk edit:
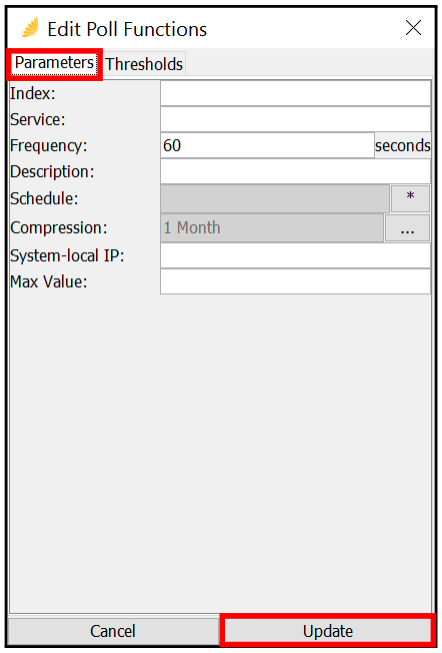
Figure 15-50 Edit Poll Functions - Bulk Add
-
Enter new values, as needed, for the Parameters to make global adjustments to the selected poll functions; then click Update.
For example, you may want to assign the same compression value for multiple poll functions or adjust the Frequency to poll every three minutes rather than every minute.
Updates are only made to modified fields.
-
Click the Thresholds tab.
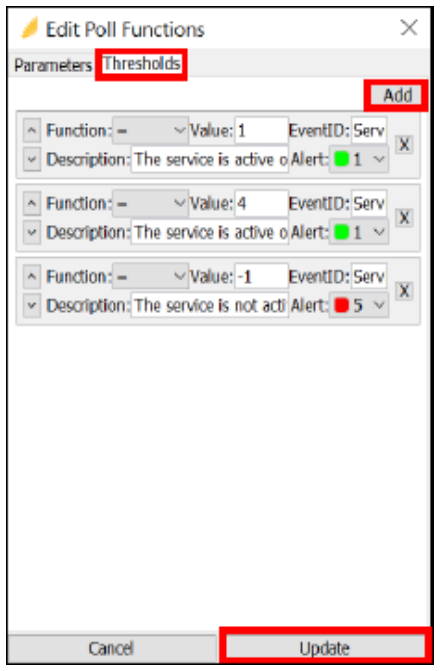
-
Click Add to create new thresholds.
For more information, see Manage Thresholds.
-
Select Update.
Note: Making ANY bulk edits to Thresholds will permanently REMOVE all previously identified thresholds.
15.7 View Polling Metric Chart
Follow these steps to view the polling metric chart for a selected poll function:
- From the Elements - Poll Functions window, double-click on a poll function to view the related chart.
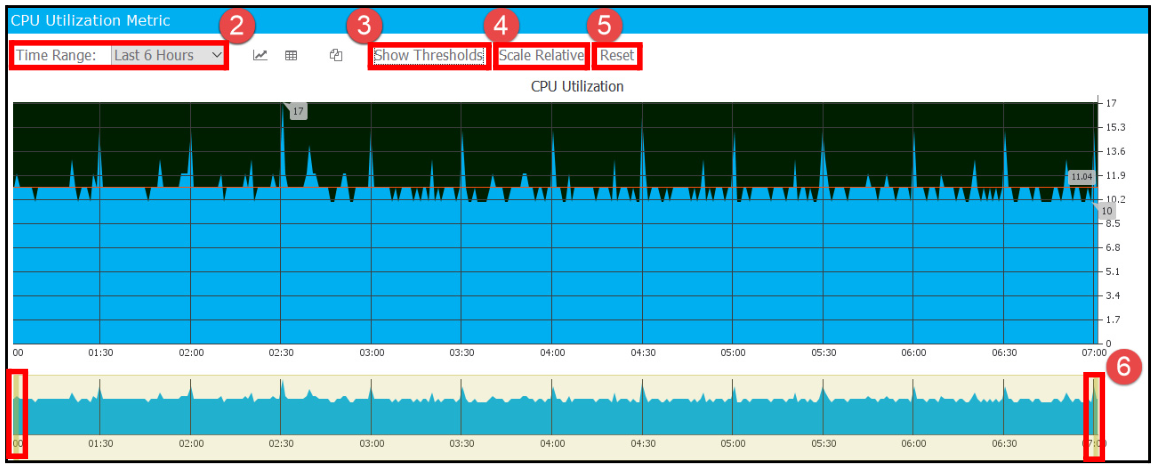
Figure 15-51 Metric Chart
-
Select a Time Range using the drop-down or select All Data to pull a complete data retrieval.
The bottom chart is a global perspective of the data.
-
Select Show Thresholds to include the polling function thresholds data.
-
Select Scale Relative to include data within a relative scale.
-
Click Reset to reset the data in the chart.
-
Click and drag the yellow line to expand or contract the amount of data that is shown in the graph.
- To show the most data, click the left yellow bar and drag it to the far left; click the right yellow bar and drag it to the far right, as shown in Figure 15-51.
- To view less data, click the left yellow bar and drag it to the right; click the right yellow bar and drag it to the left, as shown in Figure 15-52.

Figure 15-52 Metric Chart
15.8 Manage Interfaces
Manage Interfaces by entering the following information:
| Field | Description |
|---|---|
| ip | Address of the agent. |
| mask | Used to hide the actual IP address. Users will see the mask instead of the actual IP address. |
Table 15-11 Manage Interfaces
Follow these steps to verify that SNMP is working correctly:
- Check the IP address and subnet mask.
- Open a command prompt and run ipconfig:

Figure 15-53 Command Prompt
- Evaluate both the IP address and subnet mask.
- Hit a router using this. You will have multiple IP addresses to which the router answers.
16. Manage Events
Managing events includes the following tasks:
- View Events
- View Event Details
- Configure Events
- Manage Acknowledgments
- Manage Aggregate Alarms
- Manage Escalations
- Manage Event Delays
- Manage Event Forwarding
Events can be managed from the Summary View or Events window (navigate to Health > Events). Parameters for events are managed in Configure > Events.
16.1 View Events
When registering to a RIG, the registration process immediately displays the Summary window. This list-based view provides you with a quick glance of events that are triggered by a dependency tree or poller.
The Summary View can be used to translate critical system states and business processes, and the current status of the same to the Service Provider. Each of these can be used in managing service levels for the end-client.
Select an event; then right-click and select one the following options:
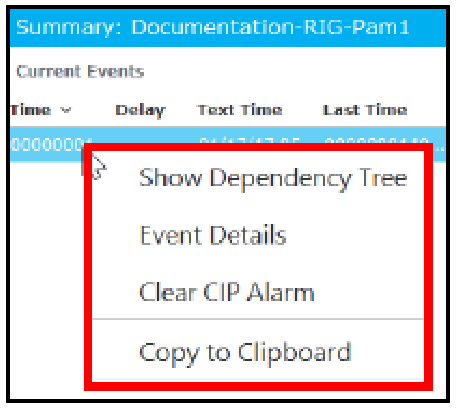
Figure 16-1 Summary - Options
| Option | Description |
|---|---|
| Show Dependency Tree | Select to view the associated dependency tree, if available. |
| Event Details | Opens the View Event pane to view details about the event. |
| Clear CIP Alarm | Permanently removes the event or dependency tree from the system. |
Table 16-1 Event Options
Each event is highlighted in a color from the alarm key referenced in Status Summary. Use this key to identify the alarm criticality.
16.1.1 Dependency Trees
Dependency trees are created per Agent using available elements and Pollers from that location. The trees maintain a live view of each individual element status contributing to the relationships. For more information on dependency trees, see Dependency Tree Management.
For example:
-
Right-click on an event and select Show Dependency Tree.
The View Dependency window appears.

Figure 16-2 View Dependency
- View all nodes of the selected dependency tree.
- Mouse-over one of the nodes to view details about the node.
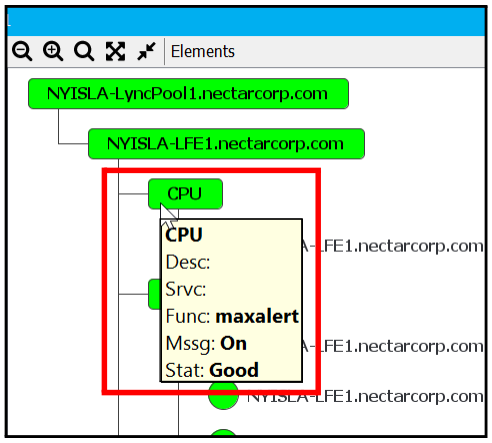
Figure 16-3 Node Details
-
Click at the top to zoom into the tree; click to zoom out.
-
To view the events associated with a node in the dependency tree, click on a node.
The related events appear in the bottom pane of the View Dependency window.

Figure 16-4 Details of Single Node Selection
-
Double-click an event in the bottom pane.
The View Event pane appears to the right with details about the event.
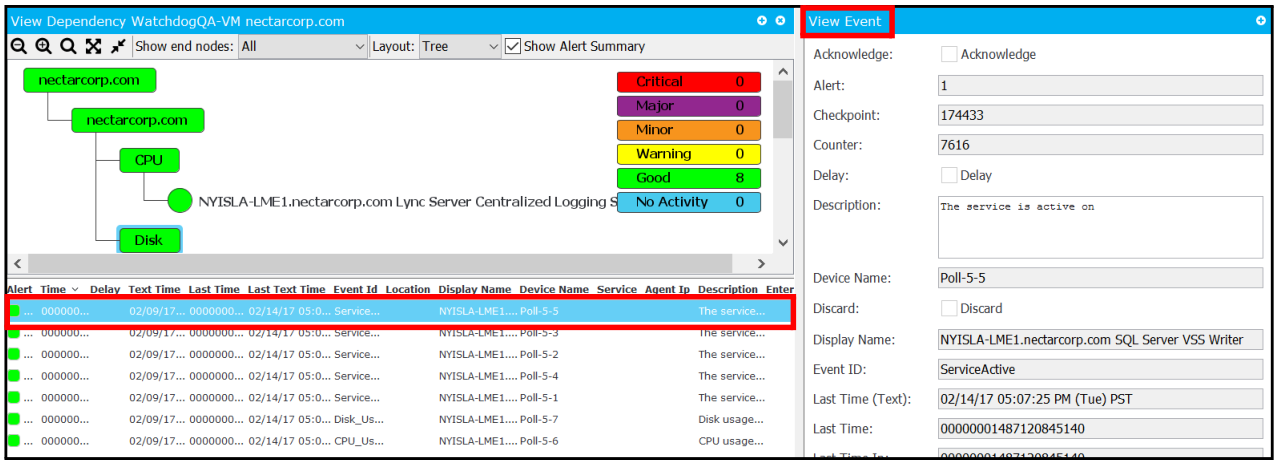
Figure 16-5 View Event Details of Dependency Tree
- Notice the Counter number and the Description summary.
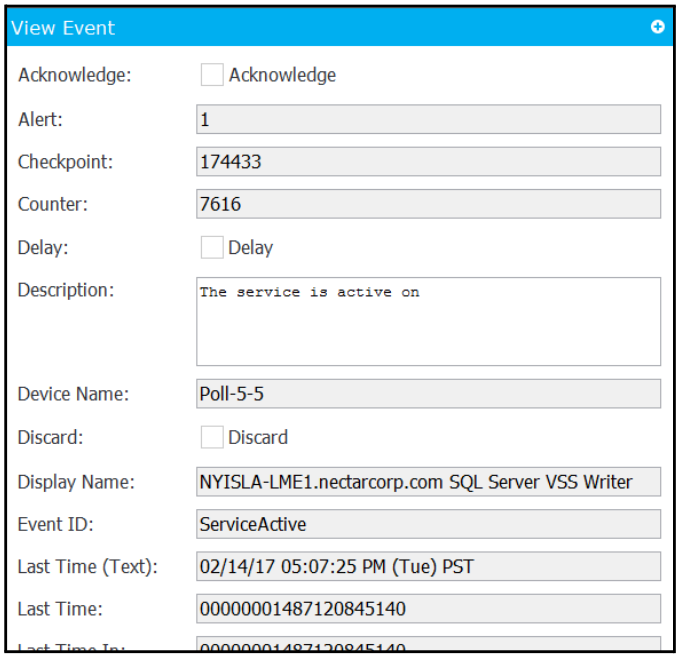
Figure 16-6 View Counter and Description
The Description can either be user defined or a listed alarm description. The Counter field displays the total number of times that the event has been merged or replaced. This prevents multiple listings of the same alarm while accounting for the total number of times that a specific alarm was triggered.
16.2 View Event Details
The core of the Nectar Foundation APM is event knowledge. Nectar Foundation APM streamlines communication between all components (CIP, RIG, and Client Application) by leveraging publish and subscribe event forwarding mechanisms. This allows the operator to experience rapid interaction with an end-client RIG even at high latency/low bandwidth conditions.
The Events module allows for the necessary steps to manage events:
- As with many fault management platforms, Nectar Foundation APM has scalable event management capabilities that include:
- Event De-duplication
- Auto correlation of up-down events
- Searchable events
- Pre- and post-processing of events
- Advanced features include:
- Synchronize event source information for live feeds.
- Multi-cast events and performance feeds to several consoles for collaboration.
- Send and receive event data to other commercial event management platforms and also proprietary or home-grown management applications that customers may have internally developed. Integration comes in the form of SNMPs, passing of SysLog feeds as well as SMTP.
- Manufacturer alarm code descriptions.
To view event level detail from a RIG, navigate to Health > Events.
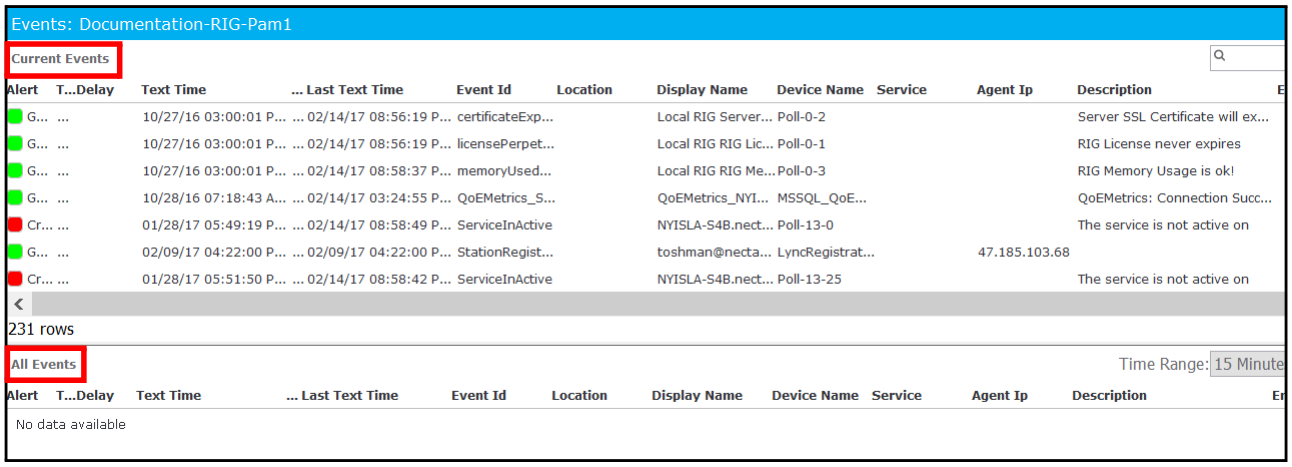
Figure 16-7 Events
Any event within the Nectar Foundation APM server flows through the Events module. This module has rules and automations that can help control the quantity and severity of events in the system, listing either events or aggregate alarms.
You can view and interact with events, which are split into two lists. The Current Events list (top pane) shows only the current events, or the events that represent the real-time status of the monitored systems. The All Events list (bottom pane) contains a history of all events.
To view events for a particular time period, select a Time Range from the drop-down menu:
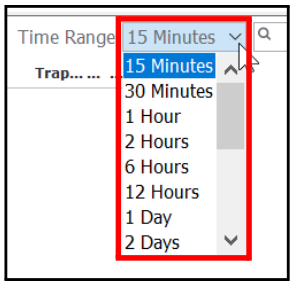
Figure 16-8 Time Range
16.3 Configure Events
As polling data enters the system, it first checks the threshold rules for the device. It then checks a series of other rules that may be assigned to a defined event for the device. These rules are organized within Configure > Events.

Figure 16-9 Configure > Events
The following directions can be applied to events:
| Field | Description |
|---|---|
| Acknowledgments | • Certain events may be related to other events, causing duplicates within event management. • Rules can be created to either merge duplicate events or replace events that are already a part of a larger event to minimize the number of events managed at a time. |
| Aggregate Alarms | • Adds a grouping of elements based upon an arbitrary filter. • For more information, see Manage Aggregate Alarms. |
| Escalations | • Events may have SLAs that require issues to be resolved within a certain service window. • A series of escalation rules can be applied to the issue and increase the alert intensity. • As events are managed, the most important issues are pushed to the top of the page, prioritizing resolution. • For more information, see Manage Escalations. |
| Event Delay | • As events are triggered within the system, some events may be common and resolve themselves within a few minutes. • A time allotment (in seconds) may be assigned to the event in order to delay action to verify that the event will not resolve without additional support. • For more information, see Manage Event Delays. |
| Event Forwarding | • Forwards an email or a specific SNMP for a specific event or group of events. • Used to integrate with other network management systems. • For more information, see Manage Event Forwarding. |
| Event Query | • Opens the Event Query window • Used to search for an event. |
Table 16-2 Event Directions
16.4 Manage Acknowledgments
Multiple events can enter the system to create duplicates. For easy management, rules can be assigned to merge or replace such events.
This section explains how to manage acknowledgments, including:
- View Acknowledgments and Rules
- Add an Acknowledgment Rule
- Remove an Acknowledgment Rule
16.4.1 View Acknowledgments and Rules
Follow these steps to view the existing acknowledgments and associated rules:
- Navigate to Configure > Events > Acknowledgments.
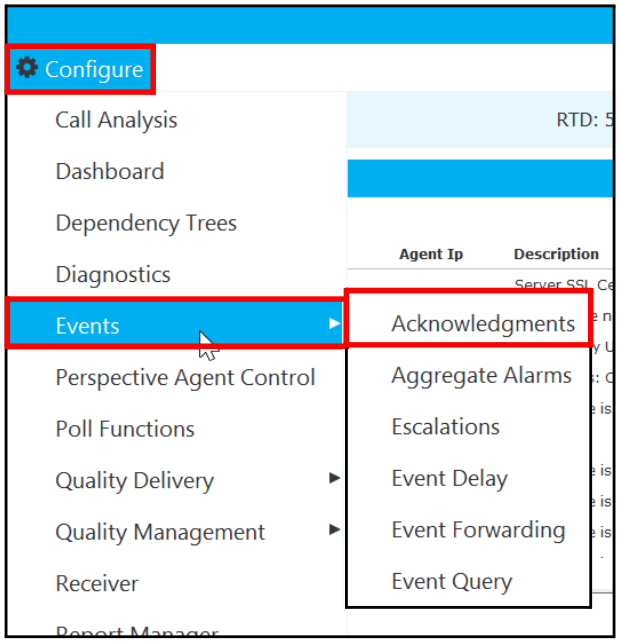
Figure 16-10 Configure > Events > Acknowledgments
The Acknowledgments window appears.

Figure 16-11 Acknowledgments
- View a list of acknowledgments in the left pane.
- Select an acknowledgment in the left pane to view the rule(s) for that acknowledgment in the right pane.
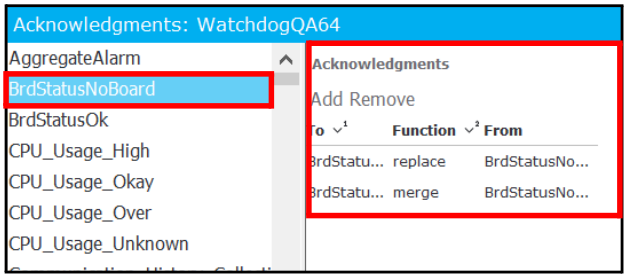
Figure 16-12 Acknowledgments and Rules
16.4.2 Add an Acknowledgment Rule
Follow these steps to add a new acknowledgment rule for the selected acknowledgment:
- View Acknowledgments and Rules.
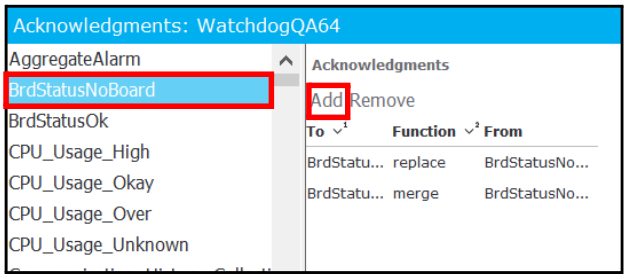
Figure 16-13 Add
-
Select an acknowledgment in the left pane.
The new rule will be added to this acknowledgment.
-
Click Add.
The Add Acknowledgment dialog box appears.
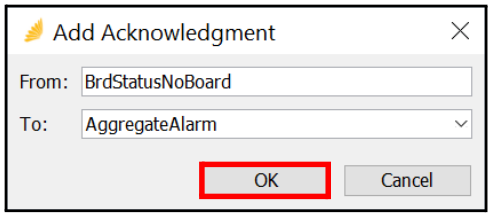
Figure 16-14 Add Acknowledgment Rule
The From field contains the selected acknowledgment from the left pane.
-
In the To field, select a new rule for the acknowledgment using the drop-down.
-
Click OK.
The new rule appears in the list in the right Acknowledgments pane.
-
Right-click on the new rule and select a new Function for the rule from one of the following:
| Function | Description |
|---|---|
| Replace | Automatically switches the function type to replace. |
| Merge | Automatically switches the function type to merge. |
| Block By | Automatically switches the function type to blockby. |
Table 16-3 Functions
16.4.3 Remove an Acknowledgment Rule
Follow these steps to remove an acknowledgment rule:
- View Acknowledgments and Rules.
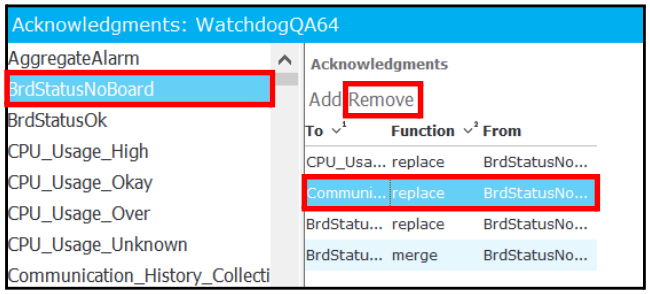
Figure 16-15 Remove
-
Select the acknowledgment rule you want to delete in the right pane.
-
Click Remove.
The Remove Acknowledgment dialog box appears with the following message:

Figure 16-16 Remove Acknowledgment
-
Click Yes.
The rule is removed from the list in the right pane.
16.5 Manage Aggregate Alarms
When you add a new element and that element is a grouping of other elements based on an arbitrary filter, any filter alarm can be created. It does not have to be in the dependency tree.
The system normally keeps track of the maximum alarm severity for each individual device name for current alarms in the system. Sometimes a system needs to be configured so that individual elements show alarm severity of events based on arbitrary filtering rules.
This section explains how to manage aggregate alarms, including:
- View Aggregate Alarms
- Add an Aggregate Alarm
- Add a Boolean Tree Expression Leg
- Edit an Aggregate Alarm
- Export an Aggregate Alarm
- Import an Aggregate Alarm
- Remove an Aggregate Alarm
- Add an Aggregate Alarm Email
- Edit an Aggregate Alarm Email
- Remove an Aggregate Alarm Email
- Connect Dependency Trees and Aggregate Alarms
16.5.1 View Aggregate Alarms
Follow these steps to view the aggregate alarms:
- Navigate to Configure > Events > Aggregate Alarms.
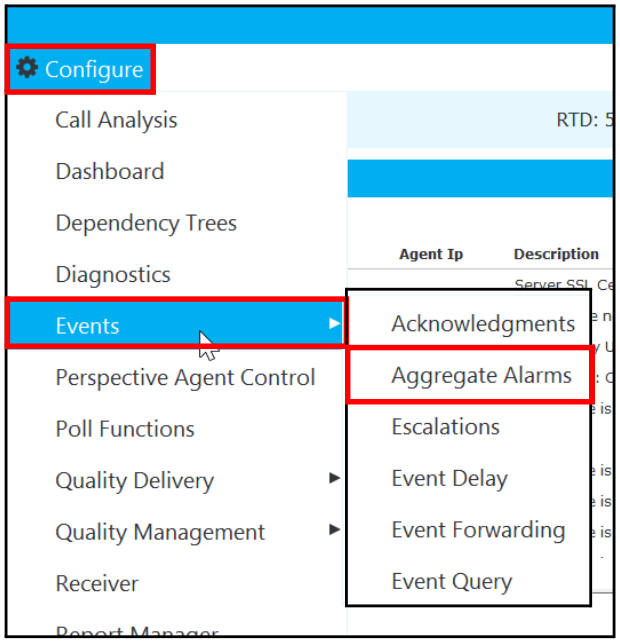
Figure 16-17 Configure > Events > Aggregate Alarms
The Aggregate Alarms - Alarms window appears.

Figure 16-18 Configure > Events > Aggregate Alarms
- View a list of the aggregate alarms.
16.5.2 Add an Aggregate Alarm
Follow these steps to add an aggregate alarm:
- View Aggregate Alarms.
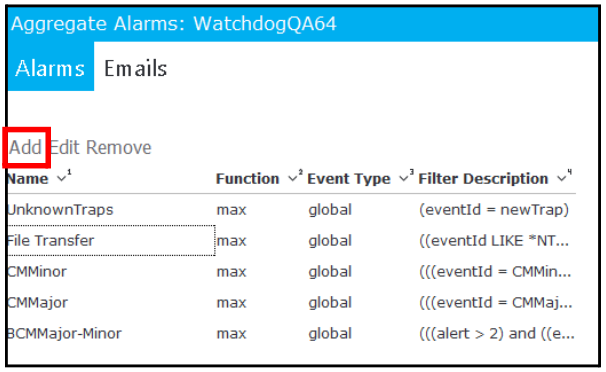
Figure 16-19 Add
-
Click Add.
The Add Aggregate Alarm dialog box appears.
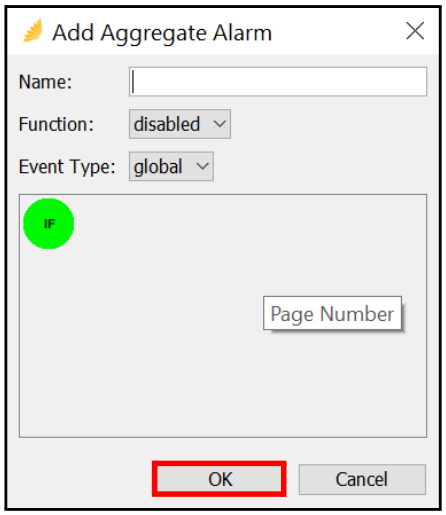
Figure 16-20 Add Aggregate Alarms
- Enter the Name of the new aggregate alarm.
- Assign rules to the aggregate alarm by entering the following information:
| Field | Description |
|---|---|
| Function | Select one of the following using the drop-down: • disabled • min - Minimum value • max - Maximum value |
| Event Type | Select one of the following using the drop-down: • local (not shared with the CIP) • global (shared with the CIP) |
Table 16-4 Add an Aggregate Alarm
- Add a Boolean Tree Expression Leg to the new aggregate alarm, if applicable.
- Click OK.
16.5.3 Add a Boolean Tree Expression Leg
In the bottom pane, you can add/update Boolean expressions that serve as filters. They can filter data to match an alarm (or an event forwarding group). The Boolean expression begins with IF and is represented by a green circle.
Follow these steps to add a Boolean tree expression leg:
- Right-click on IF and select one of the following Boolean expressions:
-
Add AND
-
Add OR
-
Add NOT
-
Add XOR
-
Add Condition
In this example, select Add Condition.
-
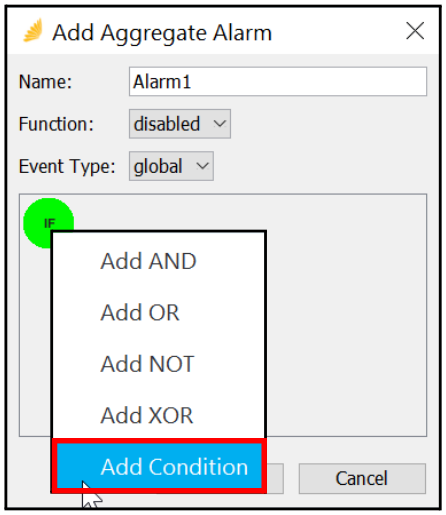
Figure 16-21 Aggregate Alarm Conditions
The following parameters appear for the IF expression.
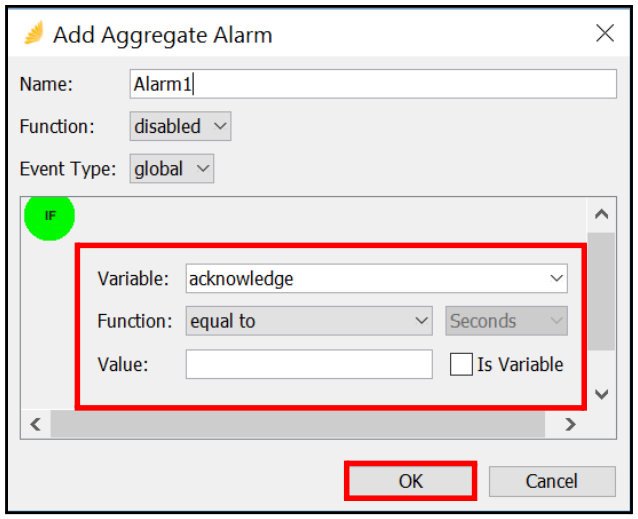
Figure 16-22 IF Parameters
- Enter the following information to define the parameters for the Boolean operation:
| Parameter | Description |
|---|---|
| Variable | Select a variable or system field name using the drop-down. |
| Function | • Select a function, which is an association between the Variable and the Value, using the drop-down. • Select one of the following, if applicable: - Seconds - Minutes - Hours |
| Value | Enter a value for the type of variable defined. |
| Is Variable | Select this check box, if the value is a variable. |
Table 16-5 Parameters
Note: If you right-click and select another Boolean operation as part of the tree expression, such as IF AND or IF OR, a separate pane appears for each operation. You will need to define the parameters for each operation.

- Click Update.
- Click Add.
16.5.4 Edit an Aggregate Alarm
Follow these steps to edit an aggregate alarm:
- View Aggregate Alarms.
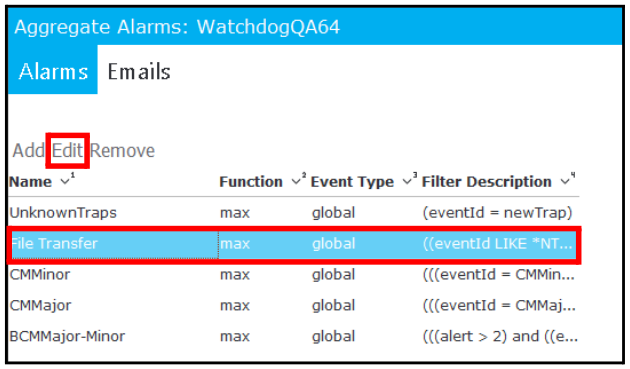
Figure 16-23 Edit
-
Select an aggregate alarm to edit; then click Edit.
The Edit Aggregate Alarms window appears.
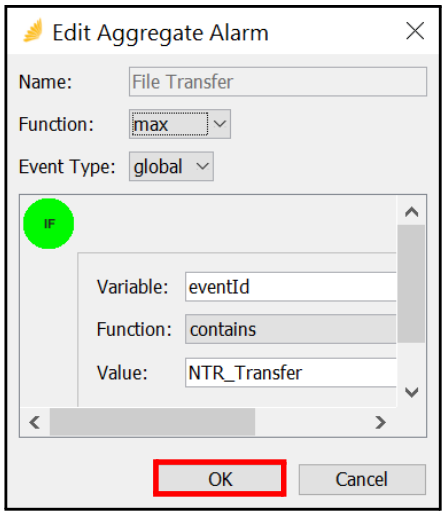
Figure 16-24 Edit Aggregate Alarms
- Select a new Function and/or Event Type for the alarm, as needed, using the drop-down.
- Change the following information, as needed, to define the parameters for the Boolean operation:
| Parameter | Description |
|---|---|
| Variable | Select a variable or system field name using the drop-down. |
| Function | • Select a function, which is an association between the Variable and the Value, using the drop-down. • Select one of the following, if applicable: - Seconds - Minutes - Hours |
| Value | Enter a value for the type of variable defined. |
| Is Variable | Select this check box, if the value is a variable. |
Table 16-6 Parameters
Note: If you right-click and select another Boolean operation as part of the tree expression, such as IF AND or IF OR, a separate pane appears for each operation. You will need to define the parameters for each operation.

- Click Update to save the Boolean tree expression leg changes.
- Click Update to save the alarm changes.
Note: After making changes, you can click Reset to reset the changed values. You can also click Remove to remove the expression values.
- Click OK.
16.5.5 Export an Aggregate Alarm
Follow these steps to export an aggregate alarm to a file on your local computer:
- View Aggregate Alarms.
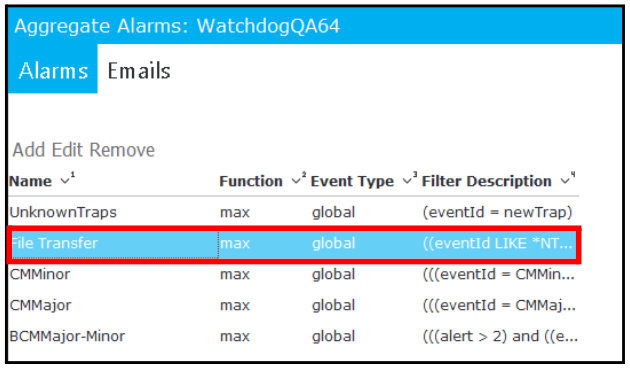
Figure 16-25 Export an Alarm File
-
Select an aggregate alarm to export; then right-click and select Export.
The Store Aggregate Device Pack File dialog box appears.
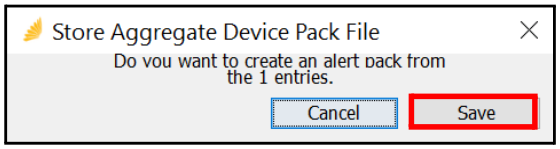
Figure 16-26 Save Aggregate Alarm
- Click Save.
- Browse to the location where you want to save the file; then click Save.
16.5.6 Import an Aggregate Alarm
Follow these steps to import an aggregate alarm file from your local computer:
-
View Aggregate Alarms.
-
Right-click and select Import.
The Open dialog box appears.
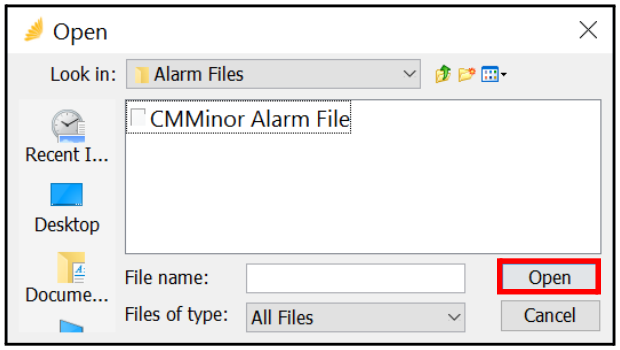
Figure 16-27 Import Aggregate Alarm File
-
Browse to the location of the file, select the file, and click Open.
The alarm file is loaded.
16.5.7 Remove an Aggregate Alarm
Follow these steps to remove an aggregate alarm:
- View Aggregate Alarms.
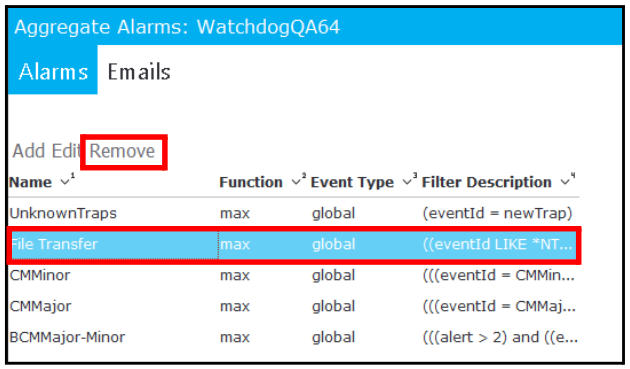
Figure 16-28 Remove
-
Select an aggregate alarm to delete; then click Remove.
The Remove Aggregate Alarms dialog box appears with the following message:
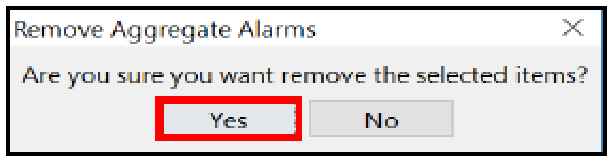
Figure 16-29 Remove Aggregate Alarms
- Click Yes.
16.5.8 Add an Aggregate Alarm Email
Follow these steps to add an email to an aggregate alarm. A notification is sent to this email address when the alarm reaches a specified alert level:
-
Navigate to Configure > Events > Aggregate Alarms.
The Aggregate Alarms window appears.
-
Click the Emails tab.
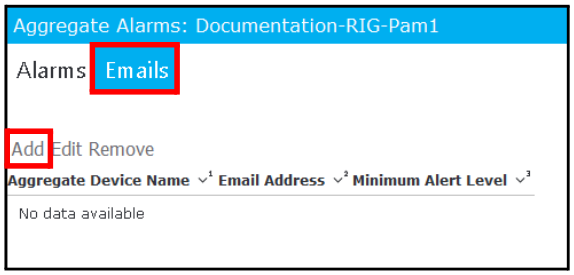
Figure 16-30 Emails
-
Click Add.
The Add Aggregate Alarm Email dialog box appears.
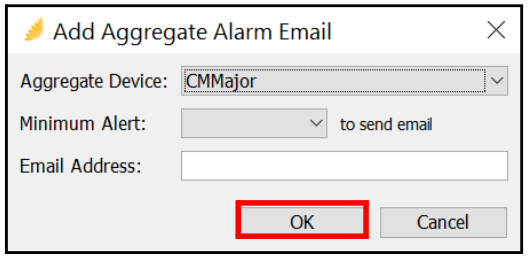
Figure 16-31 Add Aggregate Alarm Email
- Enter the following information:
| Parameter | Description |
|---|---|
| Aggregate Device | Select one of the following aggregate alarms using the drop-down: • CMMajor • CMMinor • Unknown Traps • * |
| Minimum Alert | Select an alert level for the aggregate alarm using the drop-down: • No Activity • Good • Warning • Minor • Major • Critical When the alarm reaches this alert level, it activates an email notification. |
| Email Address | Enter the email address that is notified when the aggregate alarm reaches the specified alert level. |
Table 16-7 Parameters
- Click OK.
16.5.9 Edit an Aggregate Alarm Email
Follow these steps to edit an email to an aggregate alarm. A notification is sent to this email address when the alarm reaches a specified alert level:
-
Navigate to Configure > Events > Aggregate Alarms.
The Aggregate Alarms window appears.
-
Click the Emails tab.
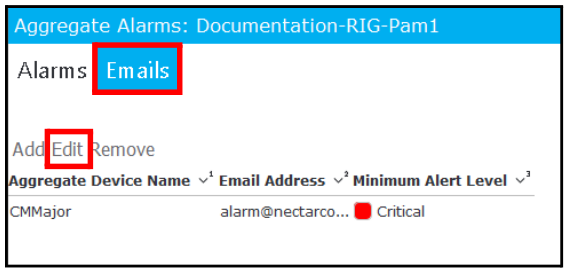
Figure 16-32 Edit
-
Select the alarm and email that you want to edit; then click Edit.
The Edit Aggregate Alarm Email dialog box appears.
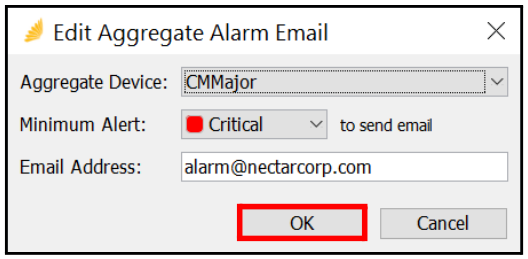
Figure 16-33 Edit Aggregate Alarm Email
- Make changes to the following parameters, as needed:
- Aggregate Device
- Minimum Alert
- Email Address
- Click OK.
16.5.10 Remove an Aggregate Alarm Email
Follow these steps to remove an email to an aggregate alarm:
-
Navigate to Configure > Events > Aggregate Alarms.
The Aggregate Alarms window appears.
-
Click the Emails tab.

Figure 16-34 Edit
-
Select the alarm and email that you want to delete; then click Remove.
The Remove Aggregate Alarms Email dialog box appears.
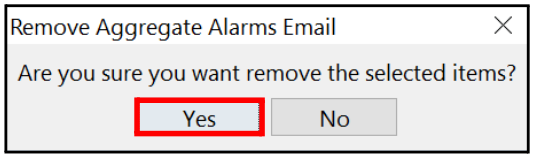
Figure 16-35 Remove Aggregate Alarms Email
- Click Yes.
16.5.11 Connect Dependency Trees and Aggregate Alarms
Follow these high-level steps to tie aggregate alarms to a dependency tree:
- Navigate to Configure > Events > Aggregate Alarms.
- Add an Aggregate Alarm.
- Navigate to Health > Element > Element Registry.
- Create the Aggregate Alarm as an element.
- Navigate to Configure > Dependency Tree.
- Select a dependency tree.
- Add the Aggregate Alarm element into a dependency tree.
16.6 Manage Escalations
Escalations allow the importance of an event to be automatically modified based upon a set of defined rules. These rules can allow a wait time to be assigned per event type. For example, after the wait time has expired, it allows an alert to change from a 2 to a 4.
For example:
- Pollers are a good example of when alert escalation procedures would be of benefit without acknowledgment.
- SNMP Trap messages are a good example of when alert escalation procedures should contain an acknowledgment. Trap messages can turn into an event, but the system has no control over when the Trap messages are called into the system. One way of controlling these events would be to enable Acknowledge and have a Wait Time of 4 hours. This would allow the event to be closed after 4 hours.
This section explains how to manage escalations, including:
- View Escalations
- Add an Escalation
- Edit an Escalation
- Remove an Escalation
16.6.1 View Escalations
Follow these steps to view the existing escalations:
- Navigate to Configure > Events > Escalations.
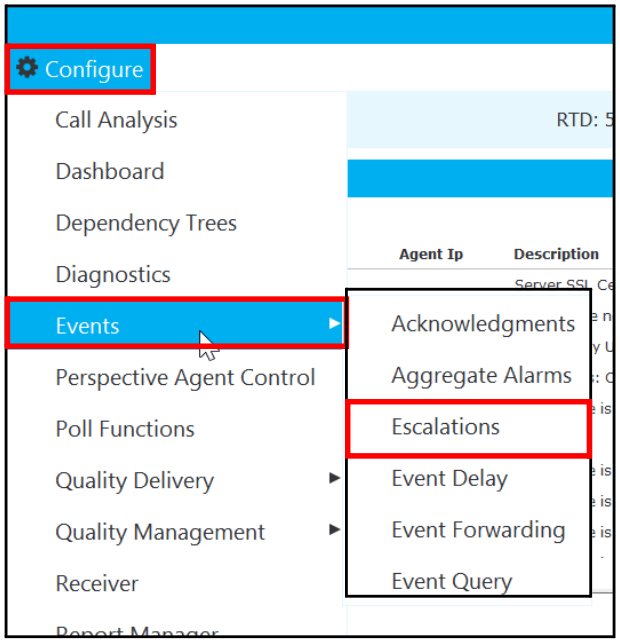
Figure 16-36 Configure > Events > Escalations
The Escalations window appears.
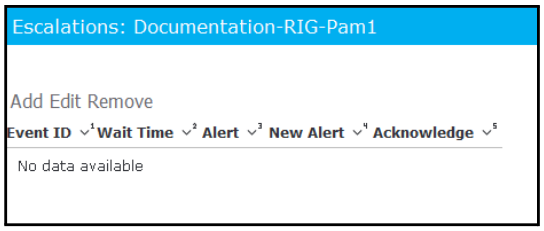
Figure 16-37 Escalations
- View any existing escalations.
16.6.2 Add an Escalation
Follow these steps to add a new escalation rule.
-
Navigate to Configure > Events > Escalations.
The Escalations window appears.

Figure 16-38 Add
-
Click Add.
The Add Escalation dialog box appears.
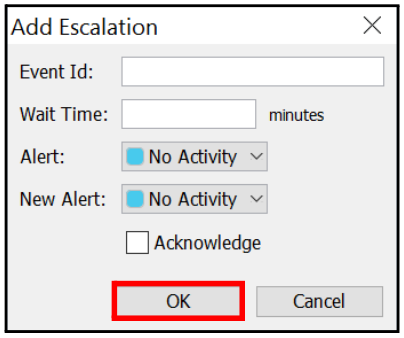
Figure 16-39 Add Escalation
- Enter the following information to create a new escalation rule:
| Field | Description |
|---|---|
| Event ID | Enter the event ID associated with this escalation. |
| Wait Time | • Enter the amount of time (in minutes) that should lapse before the rule is active. • After this wait time has expired, it allows the alert to change from a more critical alert to a less critical alert. |
| Alert | Select the alert that launches the rule into escalation using the drop- down. |
| New Alert | Select a new alert to be activated after the Wait Time has ended using the drop-down. |
| Acknowledge | Select this check box ONLY to have the event acknowledged automatically. |
Table 16-8 Add Escalation
- Click OK.
16.6.3 Edit an Escalation
Follow these steps to edit an escalation rule:
-
Navigate to Configure > Events > Escalations.
The Escalations window appears.
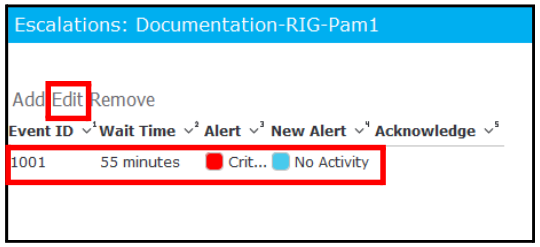
Figure 16-40 Edit
-
Select an event/escalation rule you want to edit; then click Edit.
The Edit Escalation window appears.
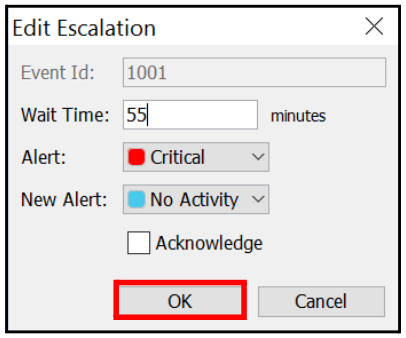
Figure 16-41 Edit Escalation
- Make changes, as needed, to the following parameters:
- Wait Time
- Alert
- New Alert
- Acknowledge
- Click OK to apply your changes.
16.6.4 Remove an Escalation
Follow these steps to remove an escalation rule:
-
Navigate to Configure > Events > Escalations.
The Escalations window appears.
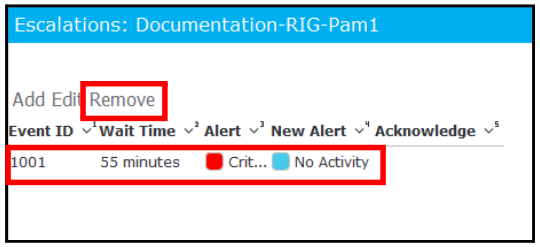
Figure 16-42 Remove
-
Select an escalation rule that you want to delete; then click Remove.
The Remove Escalation dialog box appears with the following message:
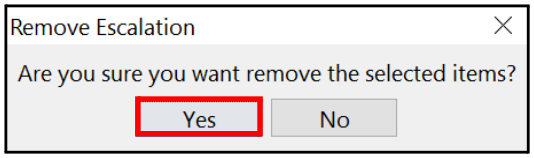
Figure 16-43 Remove
-
Click Yes.
The escalation is removed from the list.
16.7 Manage Event Delays
Event delays associate an amount of time against a certain event in order to verify the event validity. For these events, a delay may be set, while for others outside the system, a delay may or may not be required.
This section explains how to manage escalations, including:
- View Event Delays
- Add an Event Delay
- Edit an Event Delay
- Remove an Event Delay
- Global Set for Event Delay
- View an Event Delay In Action
16.7.1 View Event Delays
Follow these steps to view the existing event delay rules:
- Navigate to Configure > Events > Event Delay.
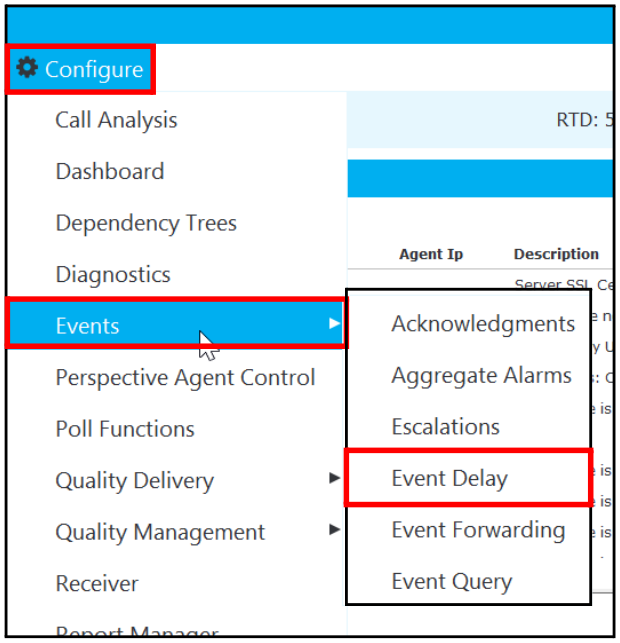
Figure 16-44 Configure > Events > Event Delay
The Event Delay window appears.

Figure 16-45 Event Delay
-
View the existing event delay rules.
-
To adjust the priority of an event delay rule:
a. Select an event delay rule.
b. Right-click and select one of the following:
| Field | Description |
|---|---|
| Move Up | To Move Up the placement of the rule into a higher priority position. |
| Move Down | To Move Down the placement of the rule to a lower priority position. |
Table 16-9 Move Up/Down
16.7.2 Add an Event Delay
Follow these steps to creates a new event delay time for a certain type of event:
-
Navigate to Configure > Events > Event Delay.
The Event Delay window appears.

Figure 16-46 Add
-
Click Add.
The Add Event Delay Rule window appears.
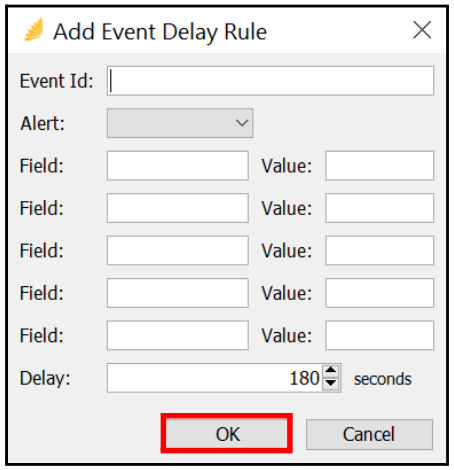
Figure 16-47 Add Event Delay
- Enter the following information to create the event delay rule:
| Field | Description |
|---|---|
| Event Id | Enter the Event Id that is associated with this event delay rule. |
| Alert | Select the alert level associated with this event delay rule using the drop-down. |
| Field | Enter a parameter for this event delay rule. |
| Value | Enter a value for the parameter (Field) for the delay rule to be applied. |
| Delay | Enter the amount of time in seconds that the event should wait until becoming an active event. |
Table 16-10 Add Event Delay
- Click OK.
16.7.3 Edit an Event Delay
Follow these steps to edit an event delay rule:
-
Navigate to Configure > Events > Event Delay.
The Event Delay window appears.
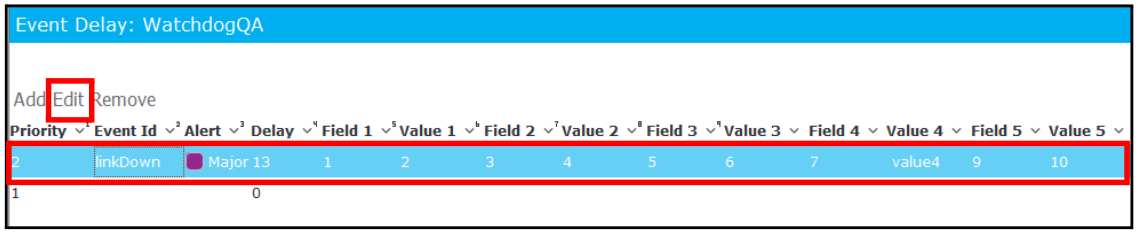
Figure 16-48 Edit
-
Select an event delay rule; then click Edit.
The Edit Event Delay Rule window appears.
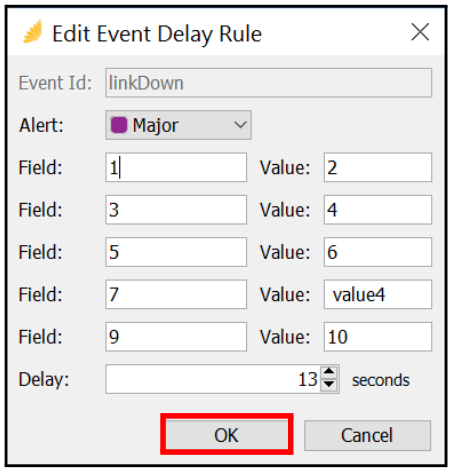
Figure 16-49 Edit Event Delay Rule
- Make changes to the following information, as needed:
- Alert
- Field
- Value
- Delay
- Click OK to apply the changes.
- Right-click within the Event Delay Setup pane to manage event delays.
16.7.4 Remove an Event Delay
Follow these steps to remove an event delay rule:
-
Navigate to Configure > Events > Event Delay.
The Event Delay window appears.
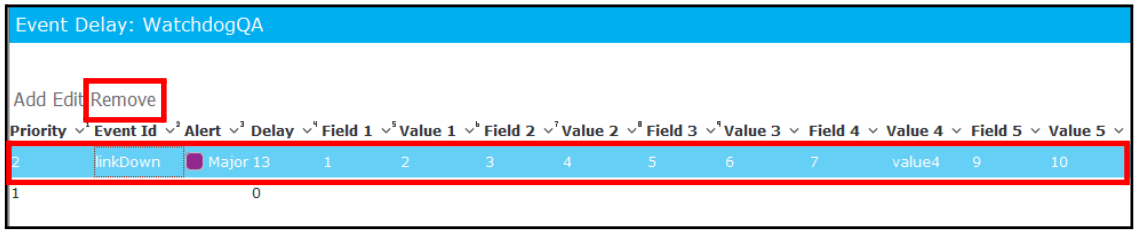
Figure 16-50 Remove
-
Select an event delay rule you want to delete; then click Remove.
The Remove Event Delay dialog box appears with the following message:

Figure 16-51 Remove Event Delay
- Click Yes.
16.7.5 Global Set for Event Delay
Follow these steps to set a system-wide default time for an event delay rule:
- Navigate to RIG > Admin > Maritime Terminal.
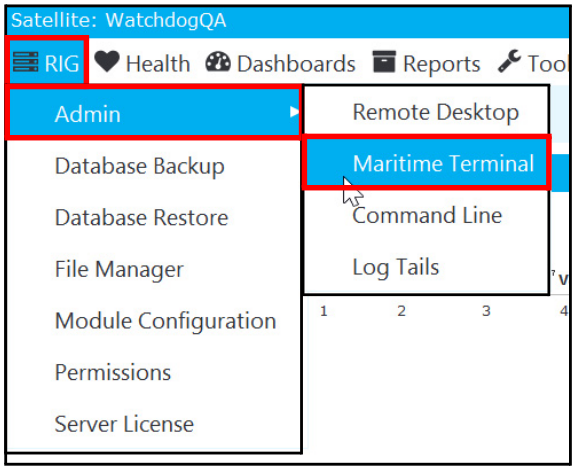
Figure 16-52 RIG > Admin > Maritime Terminal
The Telnet Maritime Terminal appears:

Figure 16-53 Maritime Terminal
-
Find out the global setting for event delay by entering:
Ahoy>GXEVENT GETEVENTDELAYTIMEThe event delay time will be retrieved for the global setting, in this case, 180.
View the following example:

Figure 16-54 Global Setting Example
-
Change the number of seconds to 20 by entering:
Ahoy> GXEVENT SETEVENTDELAYTIME 20 -
Confirm the update by entering:
Ahoy>GXEVENT GETEVENTDELAYTIMEThe updated number of seconds should display.
16.7.6 View an Event Delay In Action
Event delays associate an amount of time against a certain event to verify the event validity.
Follow these steps to view an event delay in action:
- Navigate to Health > Events.

Figure 16-55 Health > Events
The Events window appears.
-
Locate an event delay, if available.
Event delays are displayed with a clock icon under the Delay column. Once the time delay has passed, the icon is no longer visible.
The clock icon shows during the following two instances:
- Under the Current Events section, the clock icon is displayed until the designated time has passed.
- Under the All Events section, the clock icon remains associated to the acknowledged event. It shows that there was an event that was resolved before the delay time lapsed.
16.8 Manage Event Forwarding
Forwarding makes integration with Network Management Systems possible and provides a mechanism to forward events as email, client popups, rest, and syslog.
- Groups allow the server to match incoming events against a specific boolean expression, so the server can trigger forwarding via an associated agent.
- Agents process events matched by an associated group. Based on the agent type, the matched event can trigger an email, syslog message, popup on a user’s RIG client, rest message, and SNMP trap. After an event has been matched and processed, the resulting message, popup, or trap goes out immediately. The delay rules do not apply to the messages, popups, or traps distributed by the forwarding rules. Agents support these types of forwarding mechanisms:
- Email - Sends an email message to the specified email address.
- Popup - Triggers a popup message on the specified user name’s RIG client or on all user RIG clients.
- Rest - Sends rest messages to a specified URL.
- Snmptrapv1 - Sends SNMP v1 trap messages to a specified IP address.
- Snmptrapv2 - Sends SNMP v2 trap messages to a specified IP address.
- Snmptrapv3 - Sends SNMP v3 trap messages to a specified IP address.
- Syslog - Sends syslog message to a specified syslog server IP address.
This section explains how to manage Event Forwarding, including:
- Manage Event Forwarding Groups
- Manage Event Forwarding Agents
- Forwarding In Action
16.8.1 Manage Event Forwarding Groups
Groups allow the server to match incoming events against a specific boolean expression, so the server can trigger forwarding through an associated agent. To set up notifications, you use a Boolean Tree Editor.
Note: To manage event forwarding groups, you must be familiar with Boolean strings.
Follow these steps to access the event forwarding group features:
- Navigate to Configure > Events > Event Forwarding.

Figure 16-56 Configure > Events > Event Forwarding
The Event Forwarding window appears.
- Right-click within the Groups pane and view the following options, which are discussed in detail in this section:
| Command | Description |
|---|---|
| Add | Create a new group. |
| Edit | Edit an existing group. |
| Remove | Permanently delete the group from the system. |
| Enable | Enable the group, setting the Enable column to true. |
| Disable | Disable the group, setting the Enable column to false. |
| Clone | Clone the group, which creates another group with the same settings but with a different name. |
Table 16-11 Manage Groups
Add Event Forwarding Group
Follow these steps to add an event forwarding group:
-
Navigate to Configure > Events > Event Forwarding.
The Event Forwarding - Groups window appears.
-
Click Add.
The Add Forwarding Group dialog box appears.
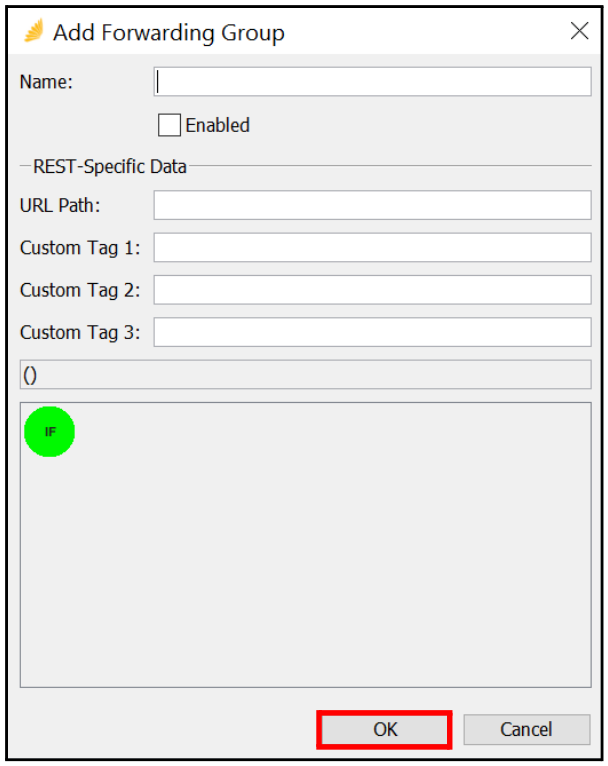
Figure 16-57 Add Forwarding Group
- Enter the following information:
| Parameter | Description |
|---|---|
| Name | Enter a name for the event forwarding group. |
| Enabled | • Use this check box to enable/disable the event forwarding group in the Enable column of the Group pane. • Enabled event forwarding group will be set to true here. |
| Rest-Specific Data | Use the next several fields only if the group will be associated with a rest event forward agent. |
| URL Path | Provide a URL path value that will be appended to an associated rest event forwarding agent's URL Base path value. |
| Custom Tag 1, 2, 3 | • Custom values that (if not blank) will be included as additional event fields in a forward rest message. • These values will be included as event fields customTag1, customTag2, and/or customTag3. • These values can be used to distinguish the matching groups, in cases where an agent is associated with multiple groups |
Table 16-12 Add Forwarding Group
- Add a Boolean Tree Expression Leg to the new event forwarding group, if applicable.
Note: After you add the tree expression leg, notice the Boolean shorthand expression that appears above the left Boolean expression pane.
-
Click Add.
The new group appears in the Group pane.
Edit an Event Forwarding Group
Follow these steps to edit an event forwarding group:
-
Navigate to Configure > Events > Event Forwarding.
The Event Forwarding - Groups window appears.
-
Select an event forwarding group you want to change; then click Edit.
The Update Forwarding Group dialog box appears.
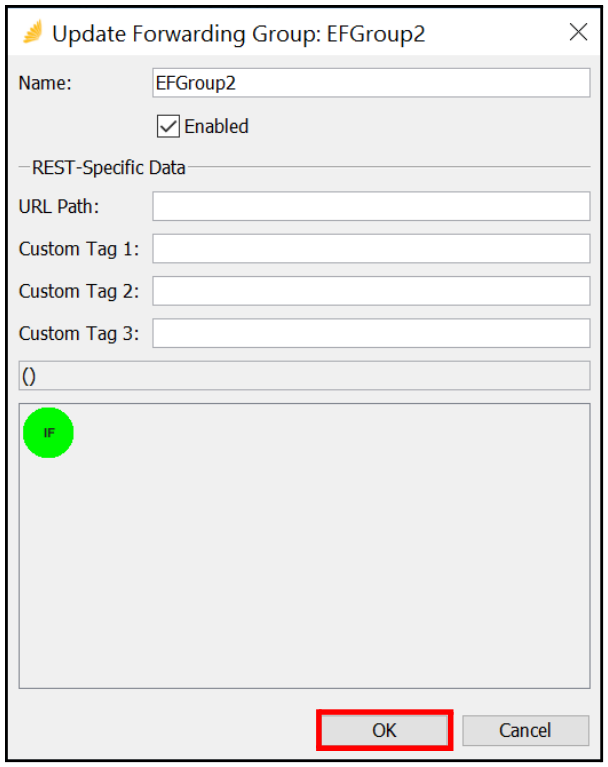
Figure 16-58 Update Forwarding Group
- Make changes, as needed, to the following parameters:
- Name
- Enabled
- Rest-Specific Data: URL Path, Custom Tag 1, 2, 3
- Right-click on IF; then add/change the Boolean Tree expression leg information, as needed:
| Parameter | Description |
|---|---|
| Variable | Select a variable or system field name using the drop-down. |
| Function | • Select a function, which is an association between the Variable and the Value, using the drop-down. • Select one of the following, if applicable: - Seconds - Minutes - Hours |
| Value | Enter a value for the type of variable defined. |
| Is Variable | Select this check box, if the value is a variable. |
Table 16-13 Parameters
Note: If you right-click and select another Boolean operation as part of the tree expression, such as IF AND or IF OR, a separate pane appears for each operation. You will need to define the parameters for each operation.
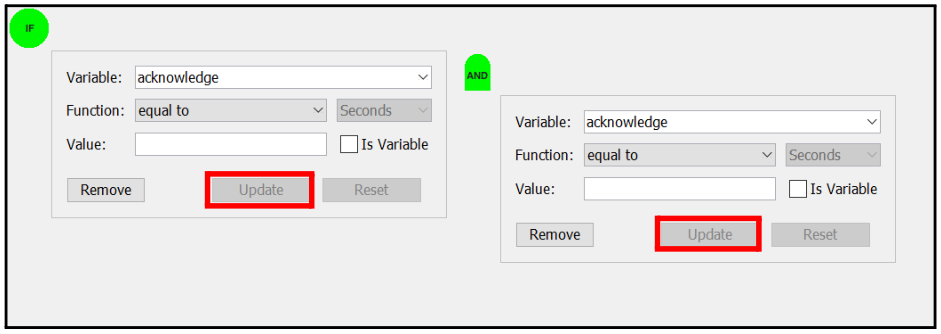
- Click Update to save the changes to each Boolean tree expression leg.
- Click OK to save the event forwarding changes.
Note: After making changes, you can click Reset to reset the changed values. You can also click Remove to remove the expression values.
Enable or Disable an Event Forwarding Group
Follow these steps to enable or disable an event forwarding group:
-
Navigate to Configure > Events > Event Forwarding.
The Event Forwarding - Groups window appears.
-
Select an event forwarding group in the Groups pane; then perform one of the following:
- If the Enable column is no, you can right-click and select Enable to enable the group.
- If the Enable column is yes, you can right-click and select Disable to disable the group.
Note: You can also enable/disable a group by checking/unchecking the Enabled check box on the Add or Update Forwarding Group dialog box. You can select multiple groups within the Groups pane using the Ctrl key on your keyboard and enable/disable them at the same time.
Remove Event Forwarding Group
Follow these steps to remove an event forwarding group:
-
Navigate to Configure > Events > Event Forwarding.
The Event Forwarding - Groups window appears.
-
Within the Groups pane, select the event forwarding group(s) that you want to remove; then click Remove.
The Remove dialog box appears with the following message:
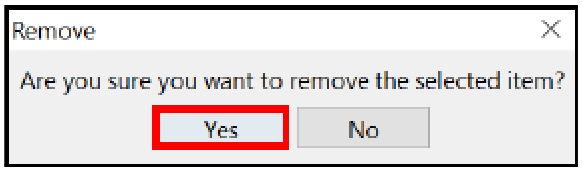
Figure 16-59 Remove
- Click Yes to remove the group.
Clone Event Forwarding Group
Cloning an event forwarding group allows you to make a copy of an existing group to create a new group.
Follow these steps to clone an event forwarding group:
-
Navigate to Configure > Events > Event Forwarding.
The Event Forwarding - Groups window appears.
-
Select the event forwarding group you want to clone.
-
Right-click on the event forwarding group and select Clone in the menu.
A new event forwarding group appears in the Groups pane with copy as part of the name.

Figure 16-60 Clone an Event Forwarding Group
- Select the cloned event forwarding group; then click Edit to rename the group and make any other changes, as needed (see Edit an Event Forwarding Group).
16.8.2 Manage Event Forwarding Agents
Agents accept the notifications sent from system groups. Agents serve as a destination for events, such as an email, syslog or Rest messages, popup windows, and so on. After an event has been declared that has forwarding rules assigned, the notification goes out Immediately. The delay rules do not apply to the notifications distributed to the forwarding rules.
Add an Event Forwarding Agent
Follow these steps to add an event forwarding agent:
-
Navigate to Configure > Events > Event Forwarding.
The Event Forwarding - Groups window appears.
-
Click the Agents tab.
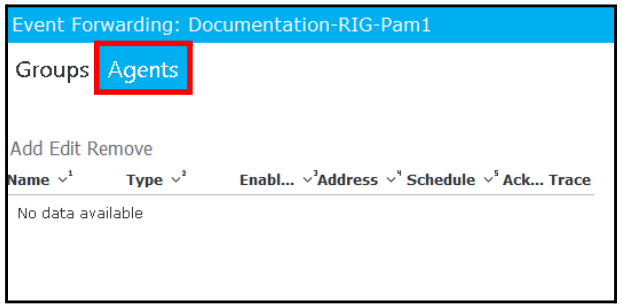
Figure 16-61 Agents Tab
-
Click Add to add a new agent.
The Add Agent - General dialog box appears.
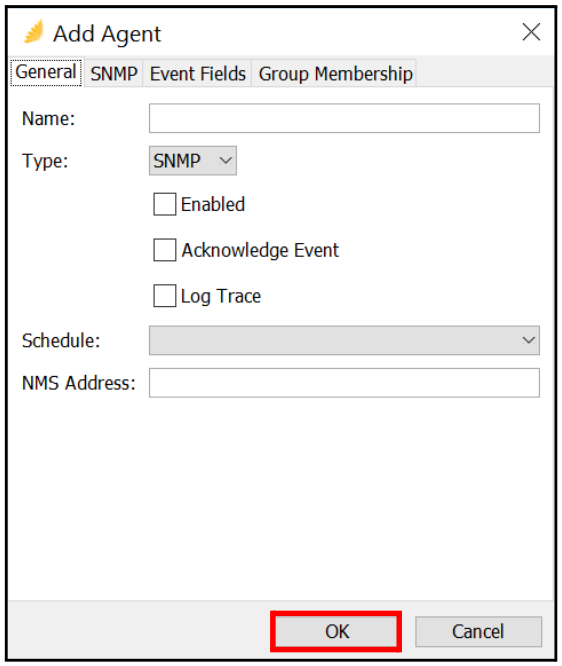
Figure 16-62 Add Agent
- Notice the following tabs. These will change based on the type of agent created.
- General
- SNMP
- Event Fields
- Group Membership
- Enter the Name of the new agent.
- Select one of the following for the Type of agent using the drop-down:
-
Email
-
Popup
-
REST
-
SNMP
-
Syslog
This selection determines the information that must be provided for the agent type. View the following table:
-
| Agent Type | Description |
|---|---|
| Displays the following tabs: • General • Group Membership |
|
| Popup | Displays the following tabs: • General • Event Fields • Group Membership |
| REST | Displays the following tabs: • General • Event Fields • Group Membership |
| SMNP | Displays the following tabs: • General • SNMP • Event Fields • Group Membership |
| Syslog | Displays the following tabs: • General • Event Fields • Group Membership |
Table 16-14 Agent Types
- Enter the following information for the General tab, if applicable:
| Parameter | Description |
|---|---|
| Enabled | • Select this checkbox to immediately enable the new agent. • Sets the status to true in the Enable column of the Agents pane. |
| Acknowledge Event | • Select this checkbox to acknowledge a matched event after processing by agent, removing it from the active queue. This can be viewed by navigating to Health > Events. • This is recommended for use with REST agents. |
| Log Trace | Select this checkbox to append agent-specific trace details to the RIG system log. |
| Schedule | • Select a schedule for the event forwarding agent using the drop- down. This is only populated if schedules are available in the system. • Schedules are created by navigating to Configure > Quality Delivery > Service Window. For more information, see Configure Service Windows. |
| NMS Address | • Enter the Network Management System IP address. • Applies when the agent type is SNMP. |
| URL Base | • Enter the URL for the system where the REST messages will be sent. • This should be a complete URL, such as http:// <address>:<port>/path2/path2 or https:// <address>:<port>/path1/path2 (where :<port> is optional). • Applies when the agent type is REST. |
| Method | • Select the request method for this agent using the drop-down. • POST is selected by default. • Applies when the agent type is REST. |
| Content Type | • Select the content type for this agent from one of the following using the drop-down: - application/json - application/xml • Applies when the agent type is REST. |
| Email Address | • Enter the email address that will receive event forwarding notifications. • Applies when the agent type is Email. |
| User Name | • Enter a RIG user name or * to view a popup to all connected users. • Applies when the agent type is Popup. |
| Description | • Enter a description for this agent that will be displayed in the resulting popup message. • Applies when the agent type is Popup. |
| Username/Password | • Enter authentication credentials, if the URL base requires authentication. • Applies when the agent type is REST. |
| Syslog Address | • Enter the Syslog server IP address. • Applies when the agent type is Syslog. |
| Message Delimiter | • Enter a message delimiter, such as ‘;’. |
| Include Field Names | • Select this checkbox to |
Table 16-15 General Tab
- Enter the following information for the SNMP tab, if applicable:
| Parameter | Description |
|---|---|
| SNMP Version | Select the SNMP version from one of the following: • V1 • V2 • V3 |
| Port | Enter the SNMP port, such as 161. |
| Community | Enter the community string previously configured. |
| Authentication | Select the authentication from one of the following: • None • MD5 • SHA • SHA-256 • SHA-512 Note: Enabled for SNMP V3 only. |
| User ID | Enter the User ID previously set up for the SNMP V3 read only credentials; must be 31 characters or less. Note: Enabled for SNMP V3 only. |
| Password | Enter the password previously set up for the SNMP V3 read only credentials; must be 31 characters or less. Note: Enabled for SNMP V3 only. |
| Privacy Protocol | Select the protocol from one of the following: • None • DES • AES • AES-192 • AES-256 Note: Enabled for SNMP V3 only. |
| Privacy Password | Enter the password for the Privacy Protocol; must be 31 characters or less. Note: Enabled for SNMP V3 only. |
| Enterprise OID | Enter the Enterprise object identifier (OID) value for this agent. Note: Enabled for SNMP V1 only. |
| Generic Trap | Enter the generic trap value for this agent. Note: Enabled for SNMP V1 only. |
| Specific Trap | Enter the specific trap value for this agent. Note: Enabled for SNMP V1 only. |
Table 16-16 SNMP Tab
- Enter the following information for the Event Fields tab, if applicable:
| Parameter | Description |
|---|---|
| Available/Selected | • Use the left and right arrows and the up and down arrows between the Available list and Selected list to select which fields will be included in the forwarded popup message. • Applies when the agent type is Popup, REST, SMNP, or Syslog. |
| Show All Fields | Select this checkbox to show all fields as opposed to only the Available fields. |
Table 16-17 Event Fields Tab
- Enter the following information for the Group Membership tab, if applicable:
| Parameter | Description |
|---|---|
| Available/Selected | • Select a group in the Available list; then click the right (>>) arrow to move it to the Selected list and associate with the new agent. • Applies to all agent types. |
Table 16-18 Group Membership Tab
-
After all of the agent information is entered, click OK.
The new agent appears in the Agents pane.
Edit an Event Forwarding Agent
Follow these steps to edit an existing event forwarding agent:
-
Navigate to Configure > Events > Event Forwarding.
The Event Forwarding - Groups window appears.
-
Click the Agents tab.

Figure 16-63 Agents Tab - Edit
-
Select an agent you want to change; then click Edit.
The Edit Agent - General dialog box appears.

Figure 16-64 Edit Agent
- Click each tab and make changes, as needed, to the agent.
Note: The tabs that appear are based on the agent type.
- Click OK.
Enable or Disable an Event Forwarding Agent
Follow these steps to enable or disable an event forwarding agent:
-
Navigate to Configure > Events > Event Forwarding.
The Event Forwarding - Groups window appears.
-
Click the Agents tab.
-
Select an agent in the Agents pane; then perform one of the following:
- If the Enable column is no, you can right-click and select Enable to enable the agent.
- If the Enable column is yes, you can right-click and select Disable to disable the agent.
Note: You can also enable/disable an agent by checking/unchecking the Enabled check box on the Add or Edit Agent dialog box.
You can select multiple agents within the Agents pane using the Ctrl key on your keyboard and enable/disable them at the same time.
Remove an Event Forwarding Agent
Follow these steps to delete an event forwarding agent:
-
Navigate to Configure > Events > Event Forwarding.
The Event Forwarding - Groups window appears.
-
Click the Agents tab.

Figure 16-65 Agents Tab - Remove
-
Select an agent you want to delete; then click Remove.
The Remove dialog box appears with the following message:
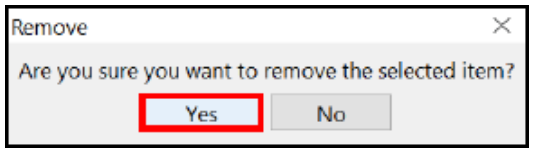
Figure 16-66 Remove
- Click Yes.
Clone an Event Forwarding Agent
Cloning an event forwarding agent allows you to make a clone (or a copy) of an existing event forwarding agent using a new agent name.
To clone an event forwarding agent:
-
Navigate to Configure > Events > Event Forwarding.
The Event Forwarding - Groups window appears.
-
Click the Agents tab.
-
Within the Agents pane, highlight the event forwarding agent you want to clone.
-
Right-click on the event forwarding agent and select Clone in the menu.
A new event forwarding agent appears in the Agents pane with copy as part of the name.
-
Select the cloned event forwarding agent; then click Edit to rename the agent and make any other changes, as needed (see Edit an Event Forwarding Agent).
16.8.3 Forwarding In Action
After an event has been matched and processed, the resulting message, popup, or trap goes out immediately. The delay rules do not apply to the messages, popups, or traps distributed by the forwarding rules.
17. Trap Receivers and Groups
This section provides information on the following:
- Trap Receivers
- Access Receiver Module
- Traps
- Trap Fields
- Trap Field Mapping
- Post Process Trap
- Community Filter
- Trap Forwarding
- Manage Trap Groups
17.1 Trap Receivers
The Trap Receiver serves as an SNMP Trap receiver. It listens for SNMP Traps that are sent by managed network devices. These monitored devices send unsolicited SNMP Traps to the Receiver module as event notifications. The Receiver module provides definitions for all Traps that are received by the Nectar platform.
A Nectar administrator can also export/import SNMP traps using Tools > SNMP > SNMP Import. If an Enterprise or RFC MIB contains SNMP V1 Trap definitions, the Import function will try to generate a Trap definition. The Alert column values will be unpopulated. The administrator can define these using a MIB definition document from the manufacturer of the monitored product.
The Receiver Module serves two basic functions:
- Listens on port 162 for Traps that are sent to Nectar.
- Stores Trap definitions and the alerting level provided upon import. When Traps arrive, the administrator performs further configurations to enable alarming.
17.2 Access Receiver Module
To access the Receiver module:
- Navigate to Configure > Receiver:
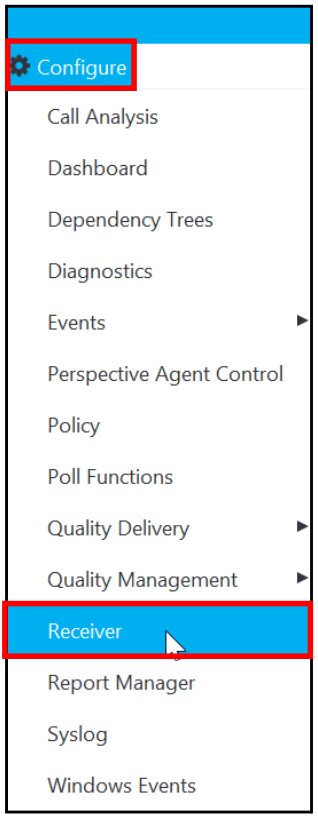
Figure 17-1 Configure > Receiver
The Receiver - Traps window appears:

Figure 17-2 Receiver Window
17.3 Traps
The Traps pane contains the following information:
| Column | Description |
|---|---|
| OID | Each SNMP Trap carries an Object Identifier Detail (OID) number to identify it within a collection of Traps. Note: Malformed OIDs will contain single numbers such as 2, 3, 4, and so on. |
| Alert | A Trap can contain one of the following event alert levels: • No Activity • Good • Warning • Minor • Major • Critical |
| Name | Identifies the associated Trap OID name that is found in a MIB browser. The Name will also be the event ID for the merging of traps. |
| Description | Provides a description of the Trap, which is limited to a 1000 characters. It can be edited in Edit Traps. |
| Acknowledge | Represents an acknowledged notification. As Traps arrive, you can close them by setting the Acknowledge field to Yes in the Edit Trap window, discussed in Edit Traps. |
| Send to Module | Indicates the loaded Nectar module that provides additional Trap handling. |
Table 17-1 Traps
17.3.1 Add Traps
Very rarely will you manually add a new Trap. You would do so when a Trap is malformed or if one is missing and you want to add a single one instead of doing an import. This feature is not the norm for adding Traps to a platform. Traps are normally imported/received. Adding a Trap is an exception to the rule.
Follow these steps to manually add a Trap.
Note: You must have the original Trap name and OID from the MIB browser.
- Click Add.

Figure 17-3 Add
The Add Trap window appears:

Figure 17-4 Add Trap
- Enter the following information:
| Field | Description |
|---|---|
| OID | Enter the OID number found in the MIB browser. |
| Name | Enter the OID name found in the MIB browser. |
| Alert | Enter the Alert associated with this OID. |
| Send To Module | Enter the loaded Nectar module that provides additional Trap handling for this OID. Note: Leave blank, if alerting product is not associated with a VKM. |
| Description | Enter the description of the Trap. Be as detailed as possible since this is the description that is displayed in the alert. |
Table 17-2 Add Trap
-
Click OK.
The Trap name is displayed in the Traps pane.
17.3.2 Edit Traps
You can edit a Trap to add additional details:
- Select a Trap in the Traps pane; then click Edit:

Figure 17-5 Edit Trap
The Edit Trap window appears.
Figure 17-6 Edit Trap

- Make changes, as needed, to the Trap.
- The Send to Module field indicates the loaded Nectar module that provides additional Trap handling. Verify that the Nectar module is accepting Traps. Consult with Nectar Support.
- Add an Acknowledgment value. This represents an acknowledged notification. When Traps arrive, you can close them by setting this field to Yes. If set to Yes, this trap will not alert, but it will immediately be acknowledged, and the alert closed.
- Click OK to save your changes.
17.3.3 Remove Trap Name (Definition)
When you remove a trap from the Receiver module, you are actually removing the individual Trap definition.
- Select a Trap in the Traps pane; then click Remove:

Figure 17-7 Remove Trap
The Remove Trap Name window appears with the following message:
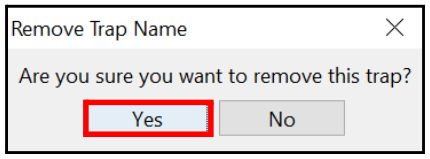
Figure 17-8 Remove Trap Name
- Click Yes to remove the trap.
17.3.4 Import/Export Traps
You can import Traps using the Import feature. You can also export Traps to your local computer for import to another RIG as follows:
- Highlight the Trap(s) that you want to export.
Note: Use the Ctrl key to select more than one trap.
- Click Export.
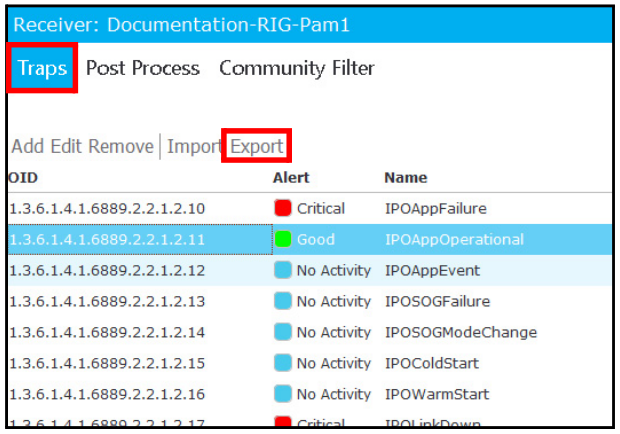
Figure 17-9 Export
- In the Export Traps window, browse to the location where you will temporarily save the exported Trap(s); then click Save:
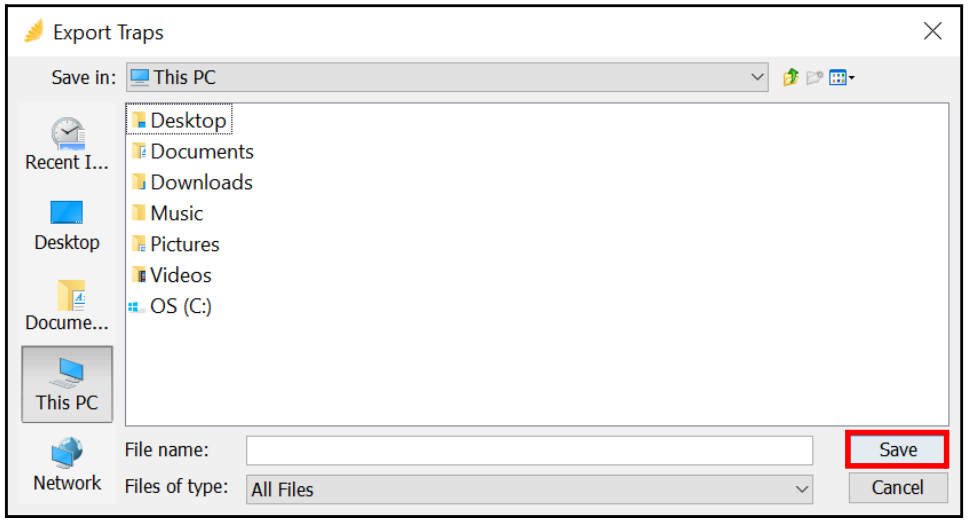
Figure 17-10 Save Exported Traps
-
Access the new RIG to which you will import the Trap(s) you exported.
-
Navigate to Configure > Receiver.
-
Click Import.
The Import Traps window appears (similar to the Export Traps window).

Figure 17-11 Import Traps
-
Browse to the trap file you saved earlier; then click Import to begin the import process.
The selected trap(s) are imported into the new RIG and can be accessed in the Receiver - Traps pane.
17.4 Trap Fields
The Fields pane provides information about the received Trap parameter fields.

Figure 17-12 Fields Pane
The Fields pane contains the following information about a selected Trap:
| Column | Description |
|---|---|
| Trap OID | When you select a Trap in the Traps pane, the associated Trap OID appears in this column. This will only be populated, if a trap has been received and these parameters are known. |
| Parameter Number | Parameter numbers received from that Trap. |
| Parameter OID | The parameter that was not NULL. (This is not actually an OID but represents the fields from within an OID.) |
| Parameter Function | Provides the function of the parameter. |
Table 17-3 Fields
Note: The purpose of the Edit feature is primarily for informational purposes only. Be very careful about editing these values. If you must edit these values, consult your Nectar representative for guidance.
17.4.1 Edit a Trap
Follow these steps to edit a trap:
- Select a Trap in the Fields pane; then click Edit:
- In the Edit Trap window, you can edit the OID. An example would be param1, param2, and so on. These are the parameter fields you would see in an event.
- Do not edit the Parameter Function field.
- Click OK to save your updates.
17.5 Trap Field Mapping
The Field Mapping pane allows you to map the parameters received in a Trap to fields within an event.
Note: Be very careful about making changes in the Field Mapping pane. If you have questions about this process, consult your Nectar representative before attempting to make changes.
The Field Mapping pane contains the following information:
| Column | Description |
|---|---|
| Parameter OID | Parameter OID assigned to the Trap. |
| Event | Represents the fields within an event. |
| Description | Represents the parameters from a Trap that you want to map to a field within the event. |
Table 17-4 Field Mapping
17.5.1 Map Parameters to Events
Follow these steps to add a parameter and map it to a field within an event:
- In the Field Mapping pane, click Add.
The Add Field Mapping window appears.
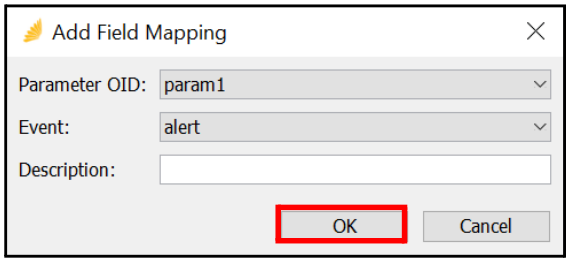
Figure 17-13 Edit Field Mapping
The Parameter OID field contains the parameter from the Trap that you want to map to an event parameter/field.
- Use the drop-down to select the Event parameter to which you want to map the selected Parameter OID (in this example, we selected alert).
- Add a Description, as needed. This data is not pertinent; it is only a comment field.
- Click OK to save your changes.
17.5.2 Edit a Mapping
Follow these steps to edit the parameter to which a Trap is mapped within an event:
- In the Field Mapping pane, select a parameter; then click Edit.
The Edit Field Mapping window appears.

Figure 17-14 Edit Field Mapping
The Parameter OID field contains the parameter from the Trap that you want to map to an event parameter/field.
- Use the drop-down to select the Event parameter to which you want to map the selected Parameter OID (in this example, we selected acknowledgeTime).
- Edit the Description field, as needed. This data is not pertinent; it is only a comment field.
- Click OK to save your changes.
17.5.3 Remove Parameters
Follow these steps to remove a parameter received in a Trap:
-
In the Field Mapping pane, select a parameter to be removed.
-
Click Remove.
The parameter is removed.
17.6 Post Process Trap
The Post Process tab of the Receiver window allows you to add, edit, or delete Trap parameter values.
Note: Be very careful about making changes in the Post Process pane. If you have
questions about this process, consult your Nectar representative before attempting to make changes.
This section explains how to:
- Add a Trap Post Processor
- Edit Trap Post Processor
- Remove Trap Post Processor
17.6.1 Add a Trap Post Processor
Follow these steps to add a Trap parameter value to the Post Process pane:
-
Click the Post Process tab.
-
Click Add.
The Add Trap Post Processor window appears.
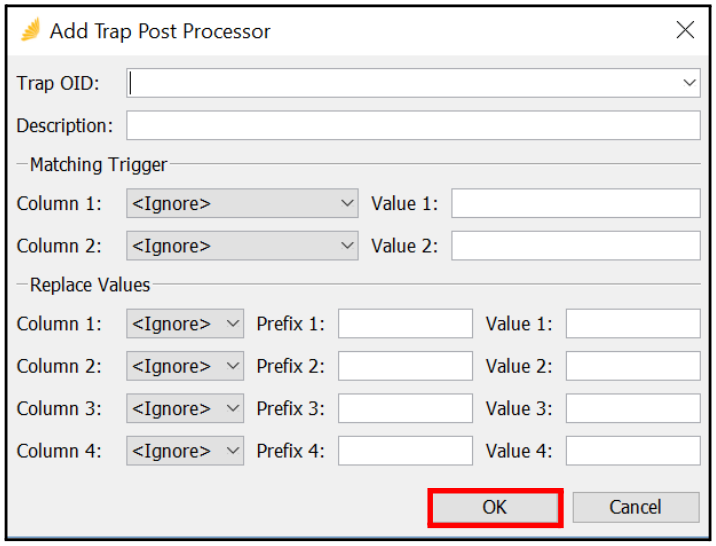
Figure 17-15 Add Trap Post Processor
-
Enter the Trap OID and a Description for the Trap parameter.
-
In the Matching Trigger area, select a parameter value in the Column 1 drop-down menu and enter an associated Value 1 value (which can be an expression or numeric value) in the provided field. Repeat for Column 2, as needed.
-
In the Replace Values area:
a. Use the Column 1 drop-down menu to select a value.
b. In the Prefix 1 field, enter a prefix for the parameter that will appear in the associated event. This is an optional step.
c. In the Value 1 field, enter the new parameter value. This value can be alpha or numeric.
d. Repeat Steps a-c to add additional columns.
-
Click OK.
This adds the Trap parameter and its OID to the Post Process pane.
17.6.2 Edit Trap Post Processor
Follow these steps to edit a parameter value on the Post Process pane:
-
Select a parameter listed in the Post Process pane; then click Edit.
The Edit Trap Post Processor window appears.

Figure 17-16 Edit Trap Post Processor
-
Change the Trap OID and a Description, as needed, for the Trap parameter.
-
In the Matching Trigger area, change the parameter value for Column 1, as needed, using the drop-down as well as the associated Value 1 value (which can be an expression or numeric value) in the provided field. Repeat for Column 2, as needed.
-
In the Replace Values area:
a. Use the Column 1 drop-down menu to change the value, as needed.
b. In the Prefix 1 field, enter or change the prefix for the parameter that appears in the associated event, as needed. This is an optional step.
c. In the Value 1 field, enter or change the parameter value, as needed. This value can be alpha or numeric.
d. Repeat Steps a-c to add or change additional columns.
-
Click OK to save your changes.
17.6.3 Remove Trap Post Processor
Follow these steps to remove a parameter value on the Post Process pane:
-
Select a parameter listed in the Post Process pane.
-
Click Remove.
The parameter is removed from the Post Process pane.
17.7 Community Filter
The Community Filter tab of the Receiver window allows you to:
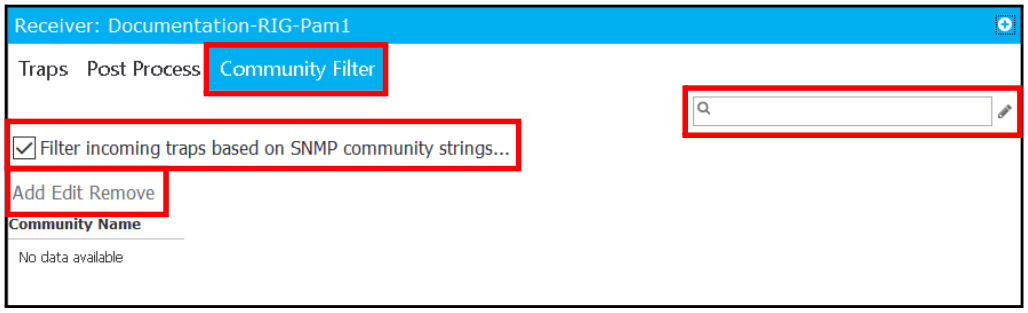
Figure 17-17 Community Filter
- Filter incoming traps based on SNMP V1, V2, and V3 community strings by selecting the associated check box.
- Search for traps based on filter rules using the search field to the right (see Trap Forwarding).
- View, add, change, or remove community names in the Community Name pane.
This section explains how to:
- Filter Incoming Traps
- Add a Community
- Edit a Community
- Remove a Community
17.7.1 Filter Incoming Traps
Click the Filter incoming traps based on SNMP community strings check box, if you want to filter incoming traps based on SNMP V1, V2, or V3 community strings.
For more information on community strings, see the following sections.
17.7.2 Add a Community
Follow these steps to add a community:
-
Navigate to Configure > Receiver.
The Receiver - Traps window appears.
-
Click the Community Filter tab.
-
Click Add.
The Add Community Filter window appears.

Figure 17-18 Add Community Filter
- Enter the following information:
| Parameter | Description |
|---|---|
| SNMP Version | Select the SNMP version from one of the following: • V1 • V2 • V3 |
| Port | Enter the SNMP port, such as 162, for V1 or V2. Enter any other port for V3. Presently, V3 cannot share port 162 with V1 and V2. |
| Community | Enter the community string previously configured. |
| Authentication | Select the authentication from one of the following: • None • MD5 • SHA • SHA-256 • SHA-512 Note: Enabled for SNMP V3 only. |
| User ID | Enter the User ID previously set up for the SNMP V3 read only credentials; must be 31 characters or less. Note: Enabled for SNMP V3 only. |
| Password | Enter the password previously set up for the NMP V3 read only credentials; must be 31 characters or less. Note: Enabled for SNMP V3 only. |
| Privacy Protocol | Select the protocol from one of the following: • None • DES • AES • AES-192 • AES-256 Note: Enabled for SNMP V3 only. |
| Privacy Password | Enter the password for the Privacy Protocol; must be 31 characters or less. Note: Enabled for SNMP V3 only. |
Table 17-5 Add Community Filter
-
Click OK.
The new Community appears in the Community Name list.
Note: If a V3 filter is added, then the Receiver Module needs to be restarted.
17.7.3 Edit a Community
Follow these steps to edit a community:
-
Select a Community; then click Edit.
The Edit Community Filter window appears.
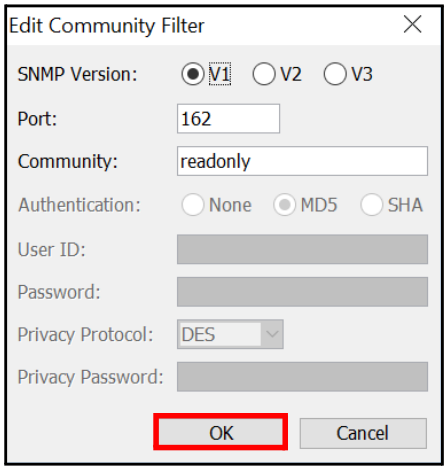
Figure 17-19 Edit
- Make changes, as needed.
- Click OK.
17.7.4 Remove a Community
Follow these steps to remove a community:
-
Select a Community.
-
Click Remove.
The Community is removed.
17.8 Trap Forwarding
Trap forwarding is managed as an event in the Events module. To learn more about managing events, see Manage Events.
17.9 Manage Trap Groups
You can use the Trap Groups feature to help you organize and sort SNMP Trap messages as they come in from specific IP addresses. Trap Groups are composed of Boolean expressions that you can define to filter SNMP Trap messages into Trap Groups. You can alse use Include or Exclude expressions to include/exclude certain SNMP messages from the Trap Groups.
Once defined, Trap Groups can be used as part of the Element Registry in Dependency Trees. For more information, see Dependency Tree Management.
Note: To use Trap Groups, you must have a general understanding of Boolean expressions
and parameters.
17.9.1 Access Trap Groups
Follow these steps to access the Trap Groups feature:
- Navigate to Health > Elements > Agents.
- Select an agent in the All Agents panel.
- Select Trap Groups in the right-most panel to display existing Trap Groups.

Figure 17-20 Select Trap Groups
17.9.2 Discover Interfaces for Trap Groups
Before using Trap Groups, you must use the Interfaces feature to locate the IP addresses for which you will create Trap Groups.
- Navigate to Health > Elements > Agents.
- In the All Agents panel, select an agent.
- Right-click on the Interfaces menu item and select Discover Interfaces from the menu:
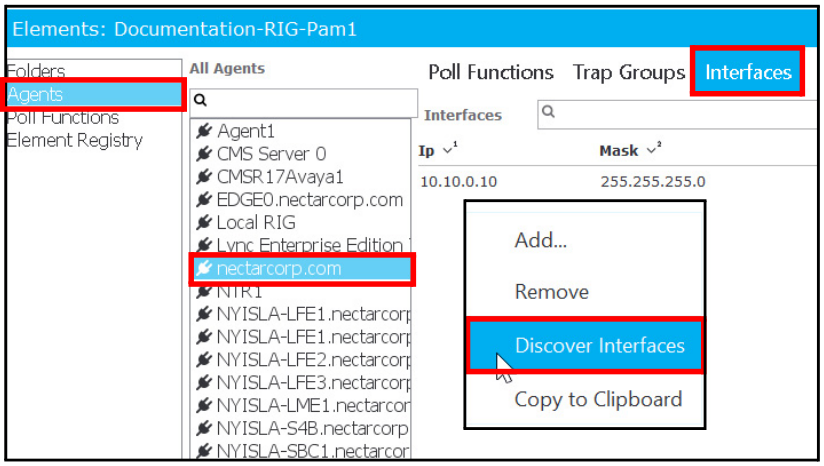
Figure 17-21 Interfaces > Discover Interfaces
Note: This will only work if SNMP has been properly administered on the Agent.
17.9.3 Edit an Existing Trap Group
Follow these steps to edit an existing Trap Group:
- Right-click on a Trap Group name and select Edit from the menu.

Figure 17-22 Edit Trap Group
The Trap Group Editor window appears. This example figure contains a Boolean expression that says “if parameter 3 (param3) equals the Trunk_Groups_xxx value, then any Trap messages coming through the associated IP address will be placed in the Trap Group named TrpGrps_xxx”.

Figure 17-23 Trap Group Editor
- If needed, edit the name of the Trap Group in the Group Name field.
- If needed, change the Include setting.
- Select Include to include all SNMP messages that match this Boolean expression.
- Uncheck the box to exclude all SNMP messages that match this Boolean expression.
- Click the green IF circle to expand the Event Filter area, where you can edit the following components to create Boolean expressions:
- Variable
- Function
- Value

Figure 17-24 Event Filter
Note: You can add as many Boolean expression conditions to the Trap Group as required.
Each time you click the IF circle, a new pane appears where you can add another Boolean expression (Variable, Function, and Value) (see Figure 17-25).

Figure 17-25 Event Filter
- Click Update to add the new parameter.
- Click OK in the Trap Group Editor window to save your changes to the Trap Group.
17.9.4 Add a New Trap Group
To edit a new Trap Group:
- Right-click anywhere in the Trap Groups pane and select Add from the menu.

Figure 17-26 Add Trap Group
The Trap Group Editor window appears, where you can add Boolean expression IF parameters to filter Trap messages that are tied to the associated IP address.
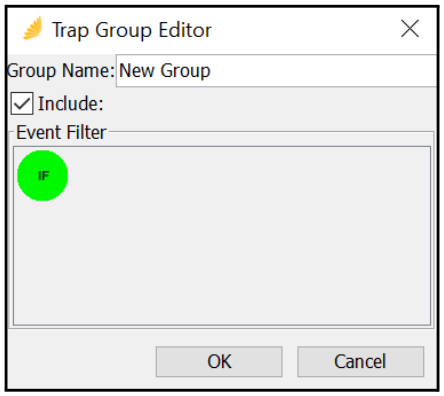
Figure 17-27 Trap Group Editor
- Enter a meaningful name for the Trap Group in the Group Name field.
- Set the Include setting.
- Select Include to include all SNMP messages that match this Boolean expression.
- Uncheck the box to exclude all SNMP messages that match this Boolean expression.
- Click the green IF circle to expand the Event Filter area, where you can configure the following components to create Boolean expressions:
- Variable
- Function
- Value
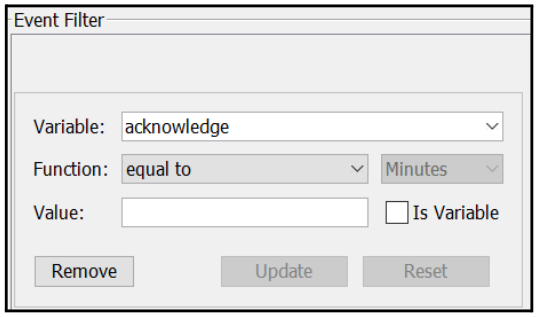
Figure 17-28 Event Filter
Note: You can add as many Boolean expression conditions to the Trap Group as required.
- Click Update to add the new parameter.
- Click OK in the Trap Group Editor window to save your changes to the Trap Group.
17.9.5 Remove a Trap Group
Follow these steps to edit remove an existing Trap Group:
- Right-click on a Trap Group name and select Remove from the menu.
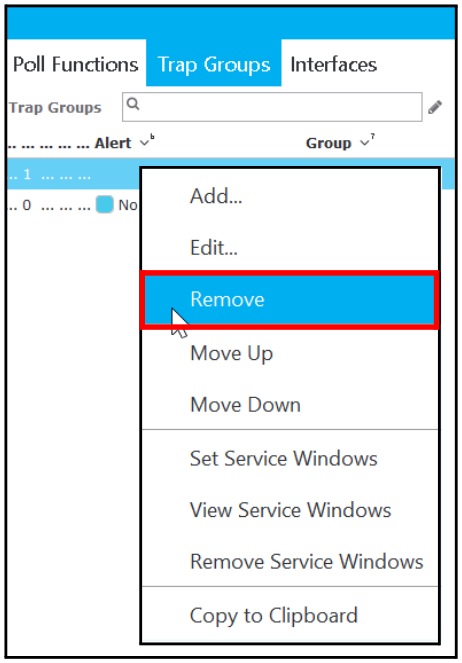
Figure 17-29 Remove
The Remove Trap Group window appears.
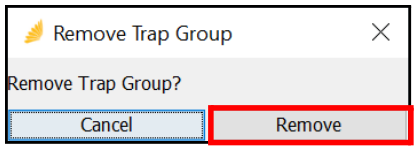
Figure 17-30 Remove Trap Group
- Click Remove.
17.9.6 Trap Group Alerts
If an SNMP message is received that matches one of the Trap Group’s Boolean expressions, an alert is displayed in the right-most panel.
- Double-click on a Trap Group name in the Trap Groups panel to check for matching alerts:

Figure 17-31 Trap Group Alert
- Double-click on an alert to view more details about the Trap Group match:
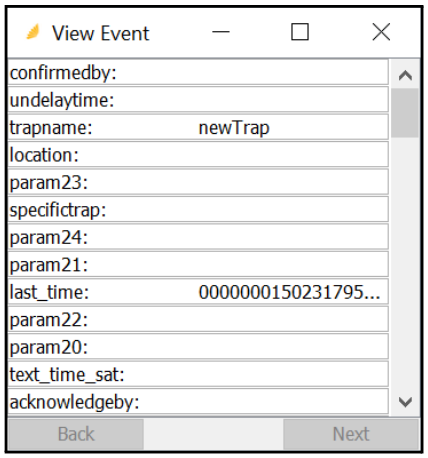
Figure 17-32 View Event
17.9.7 Move Trap Group Up/Down
The order in which Trap Groups appear in your Trap Group list is very important, as the Boolean expression parameters are filtered through from the top group down through the bottom group. If an SNMP message comes through that matches the “top” Trap Group, it is filtered by this Trap Group and the filtering stops here. If there is no match, it continues to the second Trap Group and so on. If the message does not match any Trap Group parameters, it is collected in the “General” Trap Group. Each agent has a General Trap Group, which is in essence a “INCLUDE All” Boolean expression. It collects all SNMP messages by default for the agents, unless you configure Boolean expression Trap Groups.
Note: Make sure that the General Trap Group is at the bottom of the list. You can sort the Trap Group order by clicking the Group column name.
To move Trap Groups up or down in priority (in terms of Trap SNMP message Boolean expression filtering), right-click on a Trap Group name and select Move Up/Move Down from the menu.
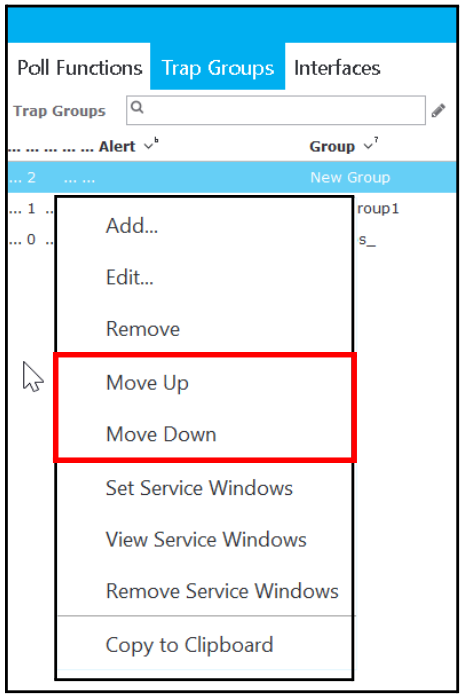
Figure 17-33 Move Up/Move Down
18. Manage Reports
Managing reports involves performing the following tasks:
- Configure Reports
- View Email History
- Add a New Report
- Edit a Report
- Report Packs/Export Packs
- Schedule a Report
- Remove a Report
- Email a Scheduled Report
- View Report Progress Details
- View Report History Details
- Inventory Reports
- Table Search
18.1 Configure Reports
You can configure certain report details to be applied to all of your company’s reports, such as adding a company or partner logo that will be added to reports and configuring your email server details.
Follow these steps to configure report details:
-
Navigate to Configure > Report Manager.
The Configure Report Manager - General window appears.

Figure 18-1 General Tab
- Enter the following details:
| Field | Description |
|---|---|
| Customer Name | Enter a name that will appear on reports, such as your company name or company group. |
| Customer Logo | Upload a company or group logo to appear on the reports. |
| Partner Logo | Upload a partner logo to appear on the reports. |
| Email Server: | |
| Server | Enter the email server domain, such as smtp.sendgrid.com. |
| Protocol | Select a server protocol, such as: • IMAP • SMTP • POP3 • HTTP |
| Port | Enter the server port using the up/down arrows; default value is 25. |
| Username/Password | Enter the email server credentials to access the server. |
| From Address | Enter the email address that will be presented on the report as the address from which the report was sent. |
| From Name | Enter a name that will appear on the report as the name from which the report was sent. This can be your name, a company name, an email address, etc. |
| Content Order | Select the content that you want to appear first (or only) on the report. Your choices include: • Events First • Events Only • Dependency Tree First • Dependency Tree Only |
Table 18-1 General Tab
- Click one of the following buttons:
- Send Test Email - Click this option to open the following Send Test Email dialog where you can enter the receiving email address to make sure everything is set up correctly and the email is sent out correctly.

Figure 18-2 Send Test Email
- Reset - Click this option to reset all parameters to reconfigure the information.
- Apply - Click this to save and apply your changes.
18.2 View Email History
You can view the email history of reports that have been sent out. This helps you monitor whether or not reports have been emailed out to people.
For more information on emailing scheduled reports, see Email a Scheduled Report.
Follow these steps to view the email history for reports:
-
Navigate to Configure > Report Manager.
The Configure Report Manager - General window appears.
-
Click the Email History tab.

Figure 18-3 Email History Tab
- View the time when the report was sent as well as its status, destination, and subject.
Note: If the email has been successfully sent out, the Status column will be empty. Otherwise, it will say Not Sent with a reason for this, such as an error.
18.3 Add a New Report
Follow these steps to add a report:
-
Navigate to Reports > Report Manager.
The Report Manager - Reports window appears.

Figure 18-4 Report Manager > Reports
- Click Add > PDF from the menu:
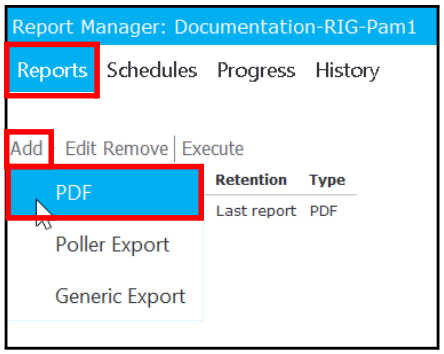
Figure 18-5 Add > PDF
The Add Report - General window appears.

Figure 18-6 General Tab
- Next, click on each of the following tabs to provide more information about the report; then click Save:
- General Tab
- Components Tab
- Properties Tab
- Advanced Tab
18.3.1 General Tab
In the General tab of the Add Report window (see Figure 18-6), enter the following information:
| Field | Description |
|---|---|
| Report Name | Enter a unique name for the report. |
| Description | Enter a brief summary of what this report captures. |
| Time Range | By default, the report uses data found in this time range: • Duration - Select the number of days/hours preceding the start day/ time on which the report will gather information. • Starts on - Select the day/hour on which the data gathering process will begin for this report. For example, the default of 7 days pulls data from the past seven days. Select 5 hours to pull data from the past five hours. |
| Retention | Controls how long reports are kept in the system: • Retain last - Select the total number of reports that will be stored for review. • Retain reports for - Select the amount of time (in weeks) that these reports will be stored for review. |
Table 18-2 General Tab
18.3.2 Components Tab
When you click the Components tab, a window similar to the following appears:
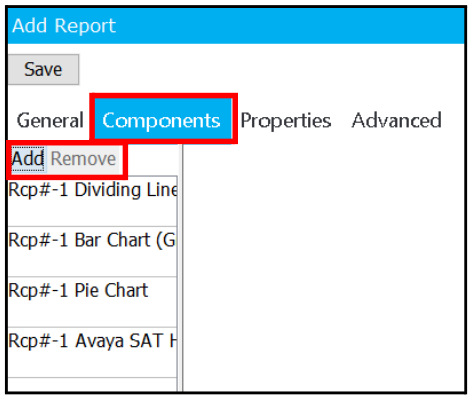
Figure 18-7 Components Tab
You can use the following tasks to manage the components in a report:
- Add a Report Component
- Remove a Report Component
Add a Report Component
You can customize a report by adding a variety of report components to the report.
Follow these steps to add a component to a report:
-
Click Add on the Components tab.
The Add Report Component window appears.
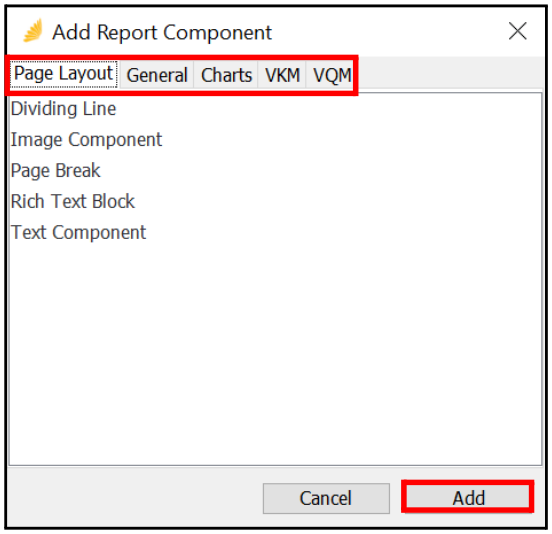
Figure 18-8 Add Report Component
-
Click on one of the following tabs, depending on the component(s) you want to add:
- Page Layout
- General
- Charts
- VKM
- VQM
-
Select a component(s) in the list; then click Add.
The new component appears in the left pane of the Add Report window under Add Remove.

Figure 18-9 Component
-
Click on a component, such as Dividing Line or Bar Chart, to open another window to customize the content.
For more information, see Table 18-1.
| Tab | Description |
|---|---|
 Page Layout Page Layout |
    Select a component from the following; then click Add: Select a component from the following; then click Add:• Dividing Line - Select the component size, line color, and line width of the dividing line. • Image Component - Select the component size and text alignment; then click the ... to browse and select an image. • Page Break - This is a banded report generator, which means that each component has a particular defined page size. If the component does not fit on the current page, a new page will be created to hold that component. • Rich Text Block - Select the component size and enter the text you want to add to the report. |
| Page Layout (continued) |  • Text Component - Select the component size, text alignment, text style, text size; then enter the text you want to add. Select the left and right margins and the color of the text. Specify whether or not to include in bookmarks and/or use as many pages as necessary (Open Ended). • Text Component - Select the component size, text alignment, text style, text size; then enter the text you want to add. Select the left and right margins and the color of the text. Specify whether or not to include in bookmarks and/or use as many pages as necessary (Open Ended). |
 General General |
   Select a component from the following; then click Add: Select a component from the following; then click Add:• End Select Group Loop • End List Report - Enter a report description; then right-click and select the event filter(s). Select the text size, specify the start/stop offset values, and whether or not to include in bookmarks for this component. • Group All Pollers in Agent - Select the agent using the drop-down; then select the maximum number of pollers for this component. • Group Select Pollers - Select the maximum number of pollers and enter a description; then right-click and select the event filter(s) for this component. |
| General (continued) |    • Grouped Agent Functions - Enter the agent name, parameter, and function(s) for this component. Click Add to add a subgroup function; click Remove to remove a subgroup function. • Live Event List Report - Enter a report description; then right-click and select the event filter(s). Select the text size and whether or not to include in bookmarks for this component. |
| General (continued) |    • Recurring Event Report - Enter a report description; then right-click and select the event filter(s). Select the text size, minimum event count, start/stop offset values, and chart size. Specify whether or not to check the several listed Include check boxes for this component. • Service Level Value - Enter the title; then select the text size, size, and service level for this component. • UpTime SLA Report - Select the size and text alignment; then enter the agent index, poll index, device name, and pre text. Specify whether or not to anchor to the poller for this component. |
 Charts Charts |
  Select a component from the following; then click Add: Select a component from the following; then click Add:• Bar Chart (Grouped by Time) - Enter the component title and description; then select the description size, size, agent index, poller, min/max/avg color, time period units, chart orientation, chart type, start/stop offset, and data store. Specify whether or not to check the several listed Include check boxes for this component. • Line Chart - Select the component size; then enter the title and description. Select the description size, agent, poller, line color and style, start/stop offset, and data store. Specify whether or not to check the several listed Include check boxes for this component. |
| Charts (continued) |    • Pie Chart - Select the component size and chart type; then enter the title and description. Select the description size, modules, and tables. Specify columns and selection criteria (show/hide SQL) and whether or not to include in bookmarks for this component. • Poller Table Report - Select the component size; then click Set/Edit Table Options to open the General Chart Options window to provide additional data. |
 VKM VKM |
  Select a component from the following; then click Add: Select a component from the following; then click Add:• ACD Highwater Counts - Enter a component title; then select the start/stop offset values. Specify whether or not to include in bookmarks for this component. • Avaya Board Report - Select the component size, chart type, and filter type; then enter the filter for this component. Specify whether or not to include in bookmarks and/or board vacancies. |
| VKM (continued) |   • Avaya Chassis Report - Specify whether or not to include in bookmarks. • Avaya SAT History Report - Enter a new title, if necessary; then select the start/stop offset values for this component. Specify whether or not to include in bookmarks. |
 VQM VQM |
  Select a component from the following; then click Add: Select a component from the following; then click Add:• Group Phone QoS By Category - Right-click and select the event filter for this component. • Phone QoS Pie Total Experience by Stream Count - Select the component size; then enter the title and description. Select the description size, chart type, and start/stop offset values. Enter a category; then specify whether or not to include in bookmarks. |
| VQM (continued) |   • Phone QoS Pie Total Experience by Threshold Seconds - Select the component size; then enter the title and description. Select the description size, chart type, and start/stop offset values. Enter a category; then specify whether or not to include in bookmarks. • Phone QoS Summary Pie Chart - Enter a new component title, if necessary, and description. Select the description size, size, data value, and start/stop offset values. Enter a category; then specify whether or not to include in bookmarks. |
| VQM (continued) |   • Phone QoS Summary Report - Enter a new component title, if necessary, and description. Select the description size, size, data value, chart orientation, chart type, line color, and start/stop offset values. Enter a category; then specify whether or not to include in bookmarks. • Phone QoS Summary Report 3D Chart - Enter a new component title, if necessary, and description. Select the description size, size, data value, view angle, bar type, and start/stop offset values. Enter a category; then specify whether or not to include in bookmarks. |
| VQM (continued) |    • Phone QoS Summary Table - Enter a new component title, if necessary, and description. Select the description size, size, data value, and start/stop offset values. Enter a category; then specify whether or not to include in bookmarks. • Phone QoS Suspect Call List - Enter a new component title, if necessary; then select the start/stop offset values. Enter a category; then specify whether or not to include in bookmarks. • Phone QoS Suspects Endpoint by Instance - Enter a new component title, if necessary, and description. Select the description size, size, top X endpoints, chart orientation, chart type, and start/stop offset values. Enter a category; then specify whether or not to include in bookmarks. |
| VQM (continued) |     • Phone QoS Suspects Endpoint by Threshold Seconds - Enter a new component title, if necessary, and description. Select the description size, size, top X endpoints, chart orientation, chart type, and start/ stop offset values. Enter a category; then specify whether or not to include in bookmarks. • Phone QoS Threshold Definitions • Stop Report if QoS category count <= x - Select the category count for this component. • Table Data Report - Select the component modules and tables. Specify columns and selection criteria (show/hide SQL) for this component. |
| VQM (continued) |   • Total Voice Stream Duration by Category by Alarm Threshold - Select the component size; then enter the title and description. Select the description size, chart type, and start/stop offset values. Specify whether or not to include in bookmarks. • Total Voice Stream Duration by Threshold - Select the component size; then enter the title and description. Select the description size, chart orientation and type, and start/stop offset values. Enter a category; then specify whether or not to include in bookmarks. |
| VQM (continued) |   • Total Voice Stream Duration by Threshold per Hour - Enter a new component title, if necessary, and description. Select the component size, chart type and orientation, and start/stop offset values. Enter a category; then specify whether or not to include in bookmarks. • Total Voice Stream Duration by Alarm Threshold - Select the component size; then enter the title and description. Select the description size, chart orientation and type, and start/stop offset values. Enter a category; then specify whether or not to include in bookmarks. |
| VQM (continued) |   • Total Voice Stream Duration by Alarm Threshold per Hour - Enter a new component title, if necessary, and description. Select the component size, chart type and orientation, and start/stop offset values. Enter a category; then specify whether or not to include in bookmarks. • Total Voice Streams by Category by Alarm Threshold - Select the component size; then enter the title and description. Select the description size, chart type, and start/stop offset values. Specify whether or not to include in bookmarks. |
Table 18-3 Components Tab
Remove a Report Component
Follow these steps to remove a report component:
- Select a report component listed in the left pane of the Components tab.

Figure 18-10 Remove a Component
- Click Remove to remove the component from the report.
18.3.3 Properties Tab
When you click the Properties tab, a window similar to the following appears:

Figure 18-11 Properties Tab
Use the following information to add additional report properties:
| Attribute | Description |
|---|---|
| Page Size | • Page type defaults to Letter. • Click the drop-down arrow and select one of the following page sizes: - Letter - Legal - Tabloid - A4 - A3 - A2 - A1 - A0 |
| Layout | • Portrait - Select to specify the report orientation as Portrait. • Landscape - Click to specify the report orientation as Landscape. |
| Margins | Select one of the following for the report margins: • Default • Custom When you select Custom, you must customize the following values: • Click the up and down arrows to the right of each margin to select a new value. • Enter a new value for each margin: - Top Margin (50pts), - Bottom Margin (100pts) - Left Margin (20pts) - Right Margin (20pts) • Include Bookmarks - Select to include as a PDF bookmark. Allows you to click on a bookmark within the report PDF and navigate directly to that section. • Include Table of Contents - Select to display a Table of Contents within the PDF. • Include debugging trace data - Select to include debugging trace data in this report. |
| Cover Page | • Select the following check boxes to include the information in the report: - Include Cover Page - Include Customer Logo - Include Partner Logo - Include Customer Name • Title Color - Click Set Color to define the font color for this report. • Notes - Enter any note text to be included in the report. |
Table 18-4 Properties Tab
18.3.4 Advanced Tab
When you click the Advanced tab, a window similar to the following appears:

Figure 18-12 Advanced Tab
This tab provides a variety of report algorithms to select from, including:
- Component
- Alternate
- Subgroup Block
- Overlapping Components
18.4 Edit a Report
Follow these steps to edit an existing report:
-
Navigate to Reports > Report Manager.
The Report Manager - Reports window appears.

Figure 18-13 Report Manager > Reports
-
Select a report; then click Edit.
The following Edit Report window appears.

Figure 18-14 Edit Report
- Make changes, as needed, to the report information under the following tabs:
- General
- Components
- Properties
- Advanced
- Click Save.
18.5 Report Packs/Export Packs
Report packs (also called PDF reports in the user interface) contain reports in PDF format. They can be saved from your RIG to a local computer using the Save Report Pack feature. They can also be loaded from a local computer to a RIG using the Load Report Pack feature.
Export packs contain reports of type Generic or Export. You can load an export pack onto your RIG using the Load Export Pack feature.
18.5.1 Save Report Packs
Follow these steps to save a report pack:
-
Navigate to Reports > Report Manager.
The Report Manager - Reports window appears.

*Figure 18-15 *
- Select a report; then right-click and navigate to Report Packs > Save Report Pack.

Figure 18-16 Save Report Pack
The Store Report Pack File window appears.
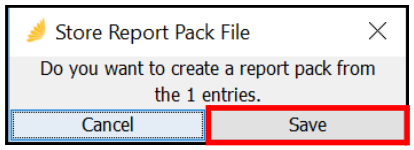
Figure 18-17 Store Report Pack
-
Click Save to save the report.
The Save window appears where you can browse to a location on your computer to store the report pack:

Figure 18-18 Save
- Click Save.
18.5.2 Load Report Packs
Follow these steps to load a report pack:
-
Navigate to Reports > Report Manager.
The Report Manager - Reports window appears.
-
Right-click in the Reports pane; then navigate to Report Packs > Load Report Pack.
The Open window appears.
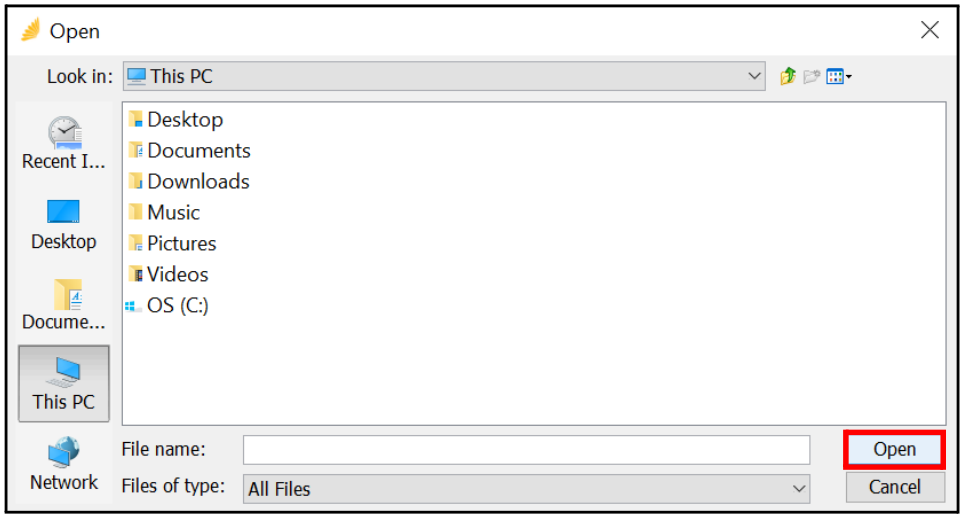
Figure 18-19 Open
- Browse to the report on your computer and click Open to load the report.
18.6 Schedule a Report
Follow these steps to schedule a report:
-
Navigate to Reports > Report Manager.
The Report Manager - Reports window appears.
-
Click on the Schedule tab.

*Figure 18-20 *
-
Click Add.
The Add Report Schedule window appears.

Figure 18-21 Add Report Schedule
- Define the following parameters for automatic report generation:
| Parameter | Description |
|---|---|
| Report | Select the report name using the drop-down. |
| Repeat | Select the frequency with which the report will be repeated from the following: • Monthly • Weekly • Daily • Hourly |
| Weeks/Days/Hours Between | Select the number of weeks/days/hours to wait between report generation. Note: The Between parameter that is activated is determined by the value selected for the Repeat parameter (Weekly, Daily, or Hourly). This parameter is deactivated when the Repeat parameter is Monthly. |
| Day of Week | Select the day of the week to generate the report. Note: This parameter is activated when Weekly is selected as the Repeat value. |
| Day of Month | Select the day of the month when the report will be generated from the following: • First Day • Last Day • Specific day of the month (1, 2, 3, ... 31) Note: This parameter is activated when Monthly is selected as the Repeat value. |
| Hour of Day | Enter the hour on which the report will be generated. Note: This parameter is activated when Monthly, Weekly, or Daily is selected as the Repeat value. This parameter is deactivated when Hourly is selected as the Repeat value. |
Table 18-5 Automatic Report Generation
-
Click OK to add the report schedule.
The details appear in the Schedules pane.
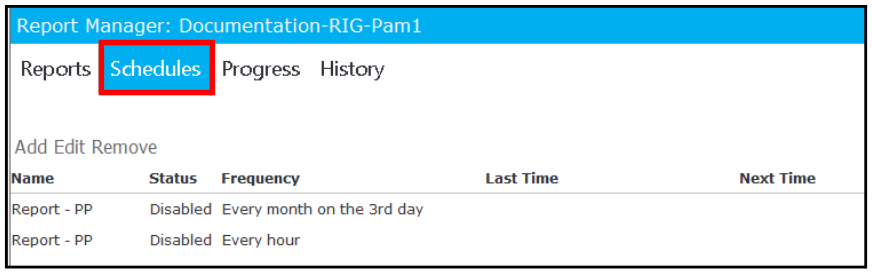
Figure 18-22 Schedule Details
- To enable a schedule, select a report in the Schedules pane; then right-click and select Enable.

Figure 18-23 Enable Schedule
The Next Time column displays the future time that the report will run.

Figure 18-24 Next Time
18.7 Remove a Report
Follow these steps to remove a report:
-
Navigate to Reports > Report Manager.
The Report Manager - Reports window appears.
-
Select the report you want to remove in the Reports pane.
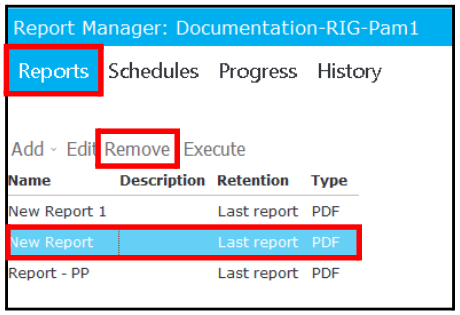
Figure 18-25 Remove Report
-
Click Remove.
The Confirm Remove Report window appears with the following message:

Figure 18-26 Confirm Remove Report
- Click Yes to remove the report.
18.8 Email a Scheduled Report
You can receive/distribute scheduled reports automatically through email.
Follow these steps to add an email address to a report:
-
Navigate to Reports > Report Manager.
The Report Manager - Reports window appears.
-
Click the Schedule tab.
-
Click Add in the Emails pane.

Figure 18-27 Add Email
The Edit Email Destination window appears.

Figure 18-28 Edit Email Destination
-
Enter the email address using the following format:
name@company.com
-
Click OK.
The address appears in the Email Address list.
Figure 18-29 Emails
-
To edit an email address:
a. Select the email address you want to change.
b. Click Edit.
The **Edit Email Destination** window appears.c. Make changes, as needed; then click OK.
-
To remove an email address:
a. Select the email address you want to delete.
b. Click Remove.
The email is removed from the list.
18.9 View Report Progress Details
You can view the name, status, start time, and progress of scheduled reports.
Follow these steps to view the progress of reports:
-
Navigate to Reports > Report Manager.
The Report Manager - Reports window appears.
-
Click the Progress tab to view the details and progress of scheduled reports.
18.9.1 Cancel a Report
To cancel a report in progress, right-click on the report and select Cancel from the menu.
18.10 View Report History Details
You can view the date, name, and size of scheduled reports. Follow these steps to view report history details:
-
Navigate to Reports > Report Manager.
The Report Manager - Reports window appears.
-
Click the History tab to view report history details.
18.10.1 View All Reports from History Tab
Follow these steps to view a PDF of a report in progress:
- Select a report.
- Click View.
18.10.2 Remove All Reports from History Tab
Follow these steps to remove a report from the History pane:
- Select a report.
- Click Remove.
18.10.3 Clear All Reports from History Tab
Follow these steps to clear a report from the History pane:
- Select a report.
- Click Clear All.
18.11 Inventory Reports
You can run inventory reports across all assets under monitoring and management. Key areas include but are not limited to:
- Avaya Communications Manager, IP Office, and System Manager
- Microsoft Skype for Business
- Cisco UCM, Unity, and Expressway
- Nortel CS1000
18.11.1 Example Report: Avaya CM Components Inventory
- Navigate to Reports > Inventory > Avaya:
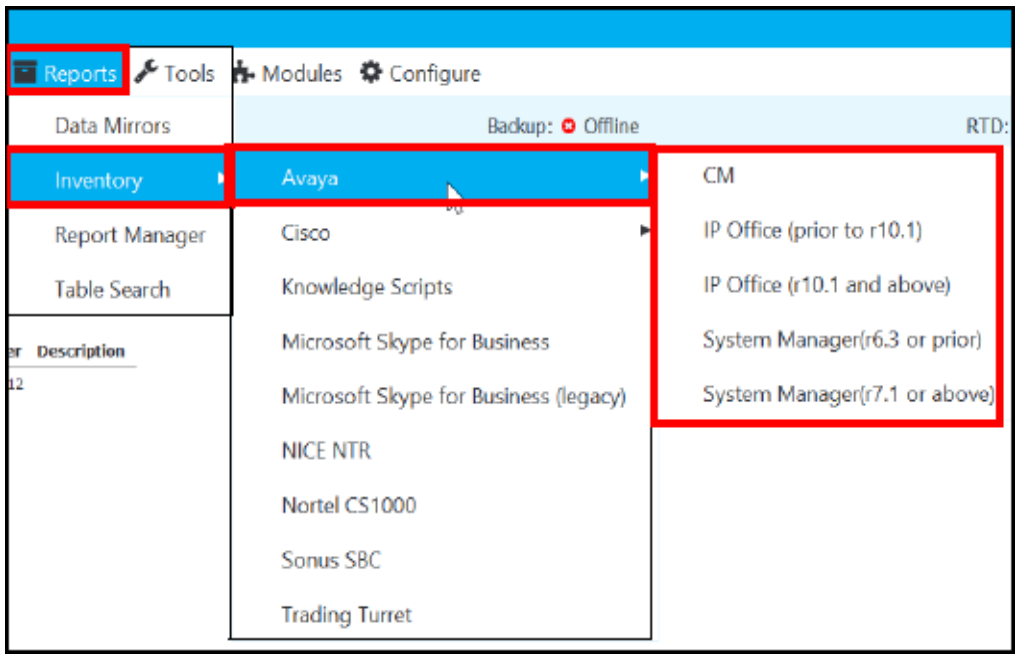
Figure 18-30 Reports > Inventory > Avaya CM
For Avaya CM, the following components appear.

Figure 18-31 Avaya CM Components
- Select a component to view more information about the component. For example, select Ports to view a complete inventory of Avaya CM ports:

Figure 18-32 Ports inventory
18.11.2 Example Report: Microsoft Skype for Business
- Navigate to Reports > Inventory > Microsoft Skype for Business.

Figure 18-33 Reports > Inventory > Microsoft Skype for Business
A list of Microsoft Skype for Business components appears.

Figure 18-34 Microsoft Skype for Business Components
- Select a component to view more information about the component. For example, click on Pool Collections to view a complete inventory of SfB Pools:
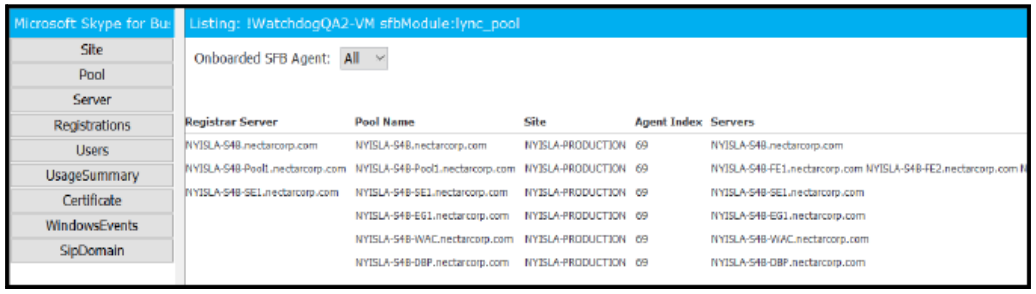
Figure 18-35 Pools
18.12 Table Search
You can use the Table Search feature to search for particular tables within modules as follows:
- Navigate to Reports > Table Search.

Figure 18-36 Reports > Table Search
The Choose Table window appears.

Figure 18-37 Choose Table
- Select the following using the drop-down:
- Module - Select the module to include in the report.
- Table - Select the table from the module you selected above to include in the report.

Figure 18-38 Choose Module/Table
- Right-click on the green IF circle to display the following table search expressions:
- Add AND
- Add OR
- Add NOT
- Add Condition

Figure 18-39 Table Search Expressions
-
Use these expressions to filter the search results and display the exact tables that you want information on.
-
Click OK when you have finished forming your search.
The table search results appear in the Table Search window.
-
To reset/redo the table search, click Redo Search in the top-left corner of the Table Search window.
Figure 18-40 Redo Search
The Choose Table window appears. Refer to Step 2.
19. Configure Syslog
Nectar Foundation APM supports the Syslog protocol, which allows you to receive Syslog messages on your local RIG. The Nectar Foundation APM Syslog feature provides a central repository for Syslog messages, which can include generalized informational, analysis, and debugging messages.
Syslog files will be stored in the Syslog directory on your local RIG.
To configure and use the Syslog feature on your RIG, follow these main steps:
- Add the IP addresses of the machines from which your RIG will receive Syslog messages. For more information, see Receive Syslog Messages.
- Add prefixes to the received Syslog (.sys) files for better organization and management of large numbers of Syslog files. You can add one prefix per machine. For more information, see Configure Syslog File Prefixes.
- Configure Linux regular expression patterns that will search for a string of text or sequence of numbers within Syslog files from a particular machine. You configure these patterns to trigger a corresponding event ID and alert level. For more information, see Configure Syslog Patterns.
Note: Nectar supports UDP 514, TCP 514, and TLS over TCP 6514 ports.
This section explains how to configure the Syslog feature, including:
- Enable Syslog
- Access Syslog
- Configure Syslog Patterns
- Receive Syslog Messages
- Configure Syslog File Prefixes
19.1 Enable Syslog
Follow these steps to enable Syslog:
- Navigate to RIG > Admin > Maritime Terminal.
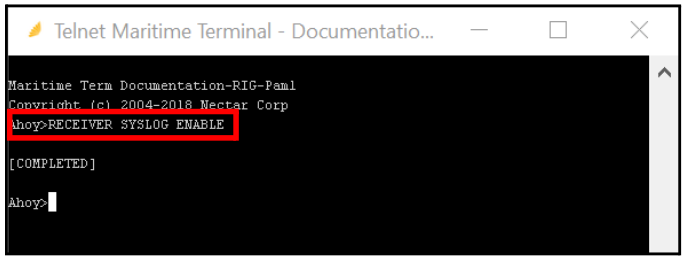
Figure 19-1 Maritime Terminal
-
At the prompt, enter the following command:
RECEIVER SYSLOG ENABLE
19.2 Access Syslog
Follow these steps to access the Syslog feature in your RIG:
- Navigate to Configure > Syslog.
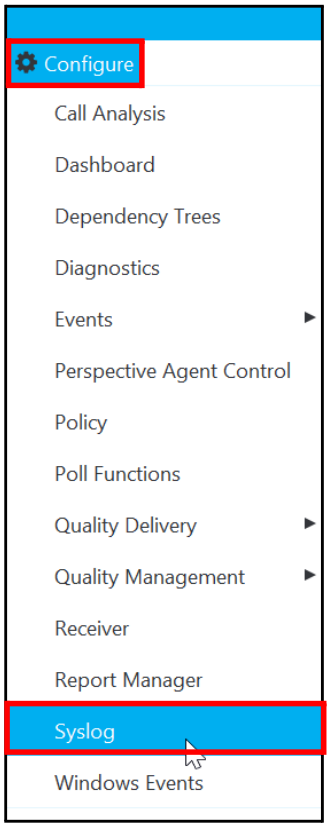
Figure 19-2 Configure > Syslog
The Syslog - Patterns window appears.

Figure 19-3 Syslog Window
19.3 Configure Syslog Patterns
To set up Syslog event alerting, you can define a Syslog pattern match. A Syslog pattern match uses Linux regular expressions, which will search for a pattern of numbers or characters within the Syslog files. You can then assign an event ID and a triggered alert level to the configured Linux regular expression pattern.
For example, if you use the .*restart.* expression pattern, any Syslog messages having the “restart” phrase will trigger the defined event ID and alert.
Note: For more information on how to manage and use events, see Manage Events.
19.3.1 Add Syslog Patterns
Follow these steps to configure your RIG to trigger an alert when it receives a certain event ID, based on a Linux regular expression pattern search:
- Click Add in the Patterns pane:
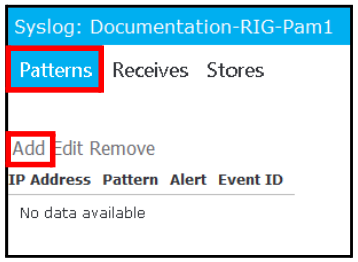
Figure 19-4 Add
The Add Pattern window appears.
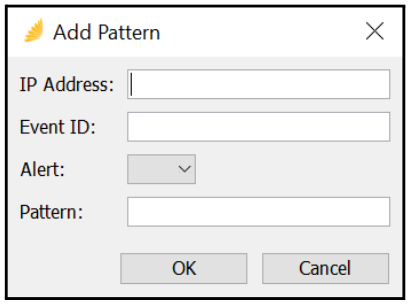
Figure 19-5 Add Pattern
- In the IP Address field, enter the IP address of a machine from which your RIG listens for Syslog messages.
- In the Event ID field, define an event ID that will be generated against the defined Linux regular expression pattern you will define in the Pattern field. For example, enter acmRestartEventId.
- Use the Alert drop-down menu to select an alert level that will be triggered by this event ID:
- 0 = No Activity
- 1 = Good
- 2 = Warning
- 3 = Minor
- 4 = Major
- 5 = Critical
- In the Pattern field, use a Linux regular expression to define the pattern of numbers or characters within the Syslog files that will trigger this event ID and associated alert level. For example, enter .*restart.* to search for any Syslog files tied to this particular IP address that contain the string “restart”.

Figure 19-6 Defined Syslog Pattern
19.3.2 Edit a Syslog Pattern
Follow these steps to edit a Syslog pattern:
-
Select an existing Syslog pattern in the Patterns pane.
-
Click Edit.
The Edit Pattern window appears.
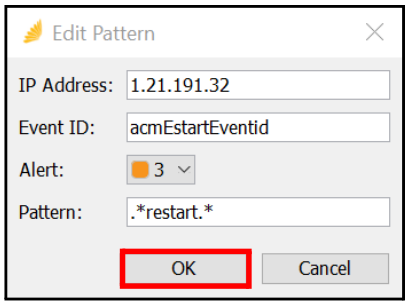
Figure 19-7 Edit Pattern
- Make changes to any of the fields, as needed.
- Click OK.
19.3.3 Remove Syslog Pattern
Follow these steps to remove a defined Syslog pattern:
-
Select an existing Syslog pattern in the Patterns pane.
-
Click Remove.
The following Remove Pattern window appears.
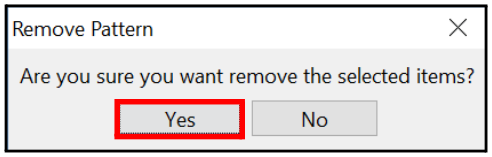
Figure 19-8 Remove Pattern
- Click Yes to remove the Syslog pattern.
19.4 Receive Syslog Messages
The Receives pane allows you to add machine IP addresses to your RIG from which you will receive Syslog messages.
When the Syslog - Patterns window appears, click the Receives tab.

Figure 19-9 Receives Tab
19.4.1 Add Machines
To add machine IP addresses to your RIG from which you will receive Syslog messages:
- Click Add in the Syslog - Receives pane.

Figure 19-10 Add
The Add Receive window appears.
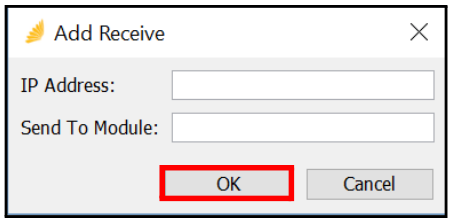
Figure 19-11 Add Receive
-
In the IP Address field, enter the IP address of a machine from which your RIG listens for Syslog messages.
Nectar recommends leaving the Send To Module field empty, unless a module is specifically configured to receive Syslog messages. At this time, no Nectar Foundation APM modules are equipped to receive Syslog messages.
-
Click OK.
-
Repeat this process to add additional machine IP addresses from which your RIG listens for Syslog messages. You can add as many IP addresses as needed.
19.4.2 Edit Machines
Follow these steps to edit a machine that is receiving Syslog information:
- Select a machine IP Address in the Syslog - Receives pane; then click Edit.

Figure 19-12 Edit
The Edit Receive window appears.
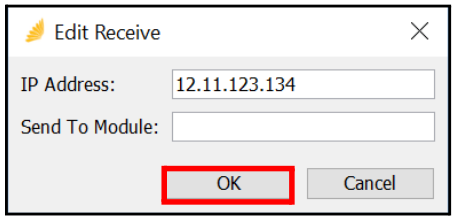
Figure 19-13 Edit Receive
- Change the machine’s IP address, if needed.
- Click OK.
19.4.3 Remove Machines
Follow these steps to remove a machine:
- Select a machine IP Address to remove in the Syslog - Receives pane; then click Remove.
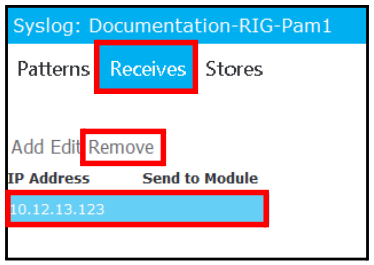
The Remove Receive window appears.

Figure 19-14 Remove Receive
- Click Yes to remove the machine.
19.5 Configure Syslog File Prefixes
Syslog messages are stored as .sys files in the Syslog directory of your local RIG.
For each machine that provides Syslog messages to the RIG, you can add a file prefix that will be appended to the beginning of all .sys files received from that particular machine.
This makes it easier to search for Syslog files in the Syslog directory and allows you to organize and manage large numbers of incoming Syslog files. The RIG automatically appends Syslog file suffixes to the files.
For example, you can add a nickname, such as AvayaSyslog, as a prefix for all files received from an Avaya machine.
Note: Syslog file names cannot have spaces. Make sure the prefix does not contain spaces.
When the Syslog - Patterns window appears, click the Stores tab.

Figure 19-15 Stores Tab
19.5.1 Add Syslog File Prefix
Follow these steps to add a prefix to Syslog files received from a particular machine:
- Click Add in the Syslog - Stores pane.
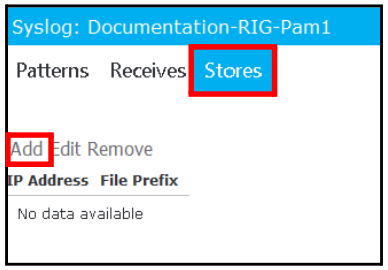
Figure 19-16 Add
The Add Store window appears.

Figure 19-17 Add Store
- In the IP Address field, enter the IP address of a machine from which your RIG listens for Syslog messages.
- In the File Prefix field, enter a prefix that will be appended to the .sys files for this machine. For example, AvayaSyslog,
- Click OK.
- Repeat this process to add prefixes to Syslog files received from other machines. You can add as many IP addresses as needed.
19.5.2 Edit Syslog File Prefix
Follow these steps to edit a prefix for a particular machine:
- Select a machine and prefix in the Syslog - Stores pane; then click Edit.

Figure 19-18 Edit
The Edit Store window appears.

Figure 19-19 Edit Store
- Make changes to any of the fields, as needed.
- Click OK.
19.5.3 Remove Syslog File Prefix
Follow these steps to remove a prefix for a particular machine:
- Select a machine and prefix in the Syslog - Stores pane; then click Remove.

Figure 19-20 Remove
The Remove Store window appears.

Figure 19-21 Remove Store
- Click Yes to remove.
20. Quality Management
Quality Management/Reporting is dependent on specific information that is available by manufacturer. For example:
- Real-Time Quality of Service (QoS) is currently available for Avaya, Perspective, and SBCs.
- Quality of Experience (QoE) metrics are available for Microsoft, Cisco, and Nortel.
- Call Detail records are available for Microsoft, Avaya, and Cisco.
The following tasks support both Real-Time QoS, QoE Reporting, and Call Detail records.
- Enable Quality Monitoring/Reporting
- View Real-Time QoS
- Call Details Filters
- Traces - Search - Debug - Configure
- Configure
- Media Processor - Search Filter Panel
- View Call Detail Records
- Configure Call Detail
20.1 Enable Quality Monitoring/Reporting
This section explains how to enable Real-Time QoS, the Call Detail Module, and Perspective QoS:
- Navigate to RIG > Module Configuration:
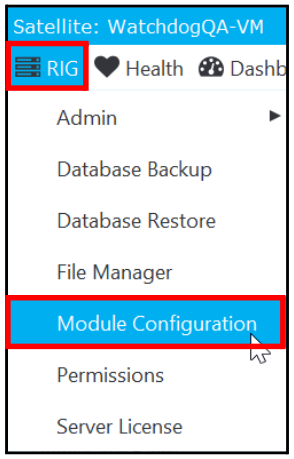
Figure 20-1 RIG > Module Configuration
- In the Module Configuration panel, select the following premium modules:
- Call Detail
- Perspective QoS Configuration/Display
- Real-Time Phone QoS Collector
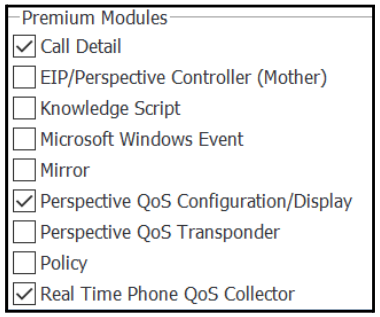
Figure 20-2 Premium Modules to Select
- Click Apply.
- Restart the RIG service to apply the changes.
20.2 View Real-Time QoS
Within the Real-Time QoS module, you can do the following:
- Monitor Phone, Video, and Perspective call details.
- View active traces, perform endpoint queries, and view debug information.
- Add, edit, and remove endpoint names to be monitored.
- Categorize RTP sessions by IP source and destination.
- Set individual thresholds by category.
- Generate events based on individual categories.
To access the Real-Time QoS module, navigate to Health > Quality Management > Real Time QoS.

Figure 20-3 Health > Quality Management > Real Time QoS
The Real Time QoS window appears:
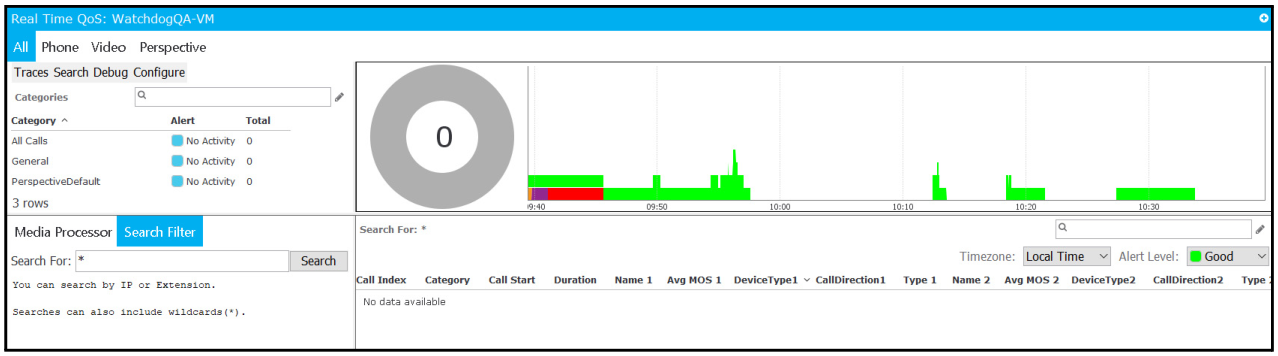
Figure 20-4 Real Time QoS
20.3 Call Details Filters
The top-left pane of the Real Time QoS window contains four tabs that allow you to filter and view call details using one of four views:
| Tab | Description |
|---|---|
| All | Select this to view All Real-Time QoS details, including Phone, Video, and Perspective. |
| Phone | Select this to view Real-Time Phone QoS details. |
| Video | Select this to view Real-Time Video QoS details. |
| Perspective | Select this to view Real-Time Perspective QoS details. |
Table 20-1 Real Time QoS
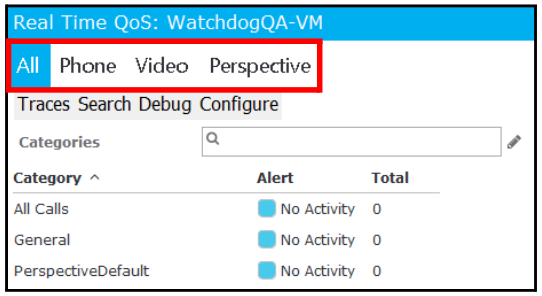
Figure 20-5 All Phone Perspective Pane Views
20.4 Traces - Search - Debug - Configure
The top-left pane of the Real-Time QoS window also contains the following four options, which are discussed in more detail in this section:
- Traces
- Search
- Debug
- Configure
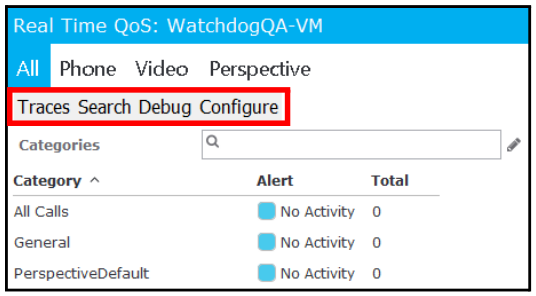
Figure 20-6 Traces - Search - Debug
20.4.1 Traces
Click the Traces option to open the Trace Route window to view a live diagram of active traces:
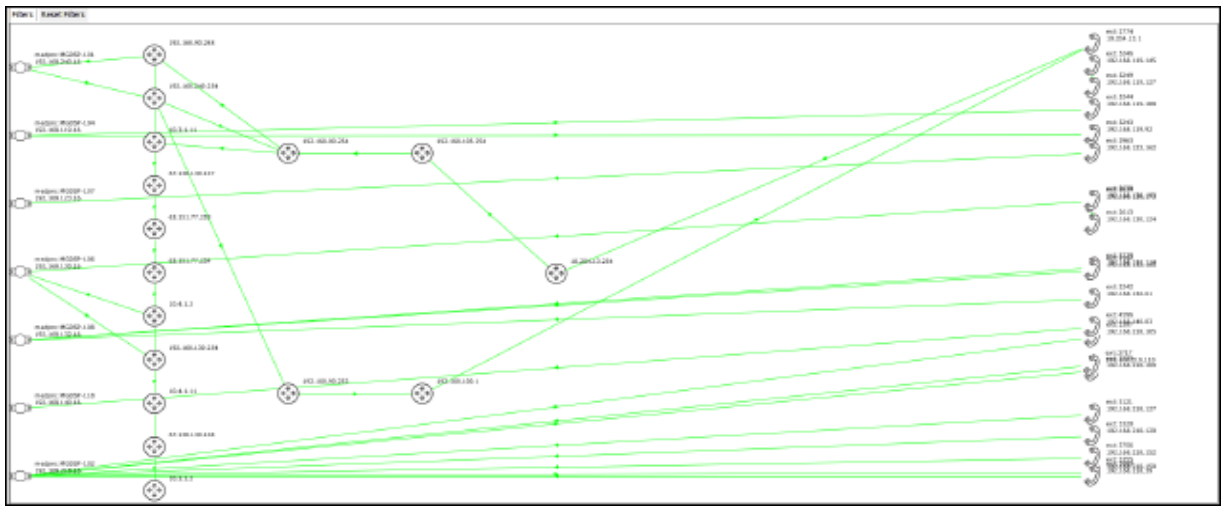
Figure 20-7 Live Traces
Within this diagram, you have two options:

Figure 20-8 Filters/Reset Filters
| Option | Description |
|---|---|
| Filters | Click this to set up a filter to view details by Alert, Categories, and Addresses. |
| Reset Filters | Click this to reset your filters to their original settings. |
Table 20-2 Filters
20.4.2 Search
Follow these steps to use the Search option:
-
Click Search.
The Real Time QoS Query window appears where you can search for call details using a variety of filters:
| Filter | Description |
|---|---|
| Endpoint 1 | You can search for call details on a single endpoint by selecting one of the following; • Any • Extension • Device Name • MedPro • IP |
| Endpoint 2 | You can search for call details on a second endpoint by selecting one of the following: • Any • Extension • Device Name • MedPro • IP |
| Duration | Select one of the following; then enter the search duration in seconds. The default value is 10 seconds: • less than • greater than |
| Start On | Select the start date/time for the search using the drop-down. |
| Stop At | Select the stop date/time for the search using the drop-down. |
Table 20-3 Filters
-
Click Search to begin the search.
The results of the search appear in the lower pane.

Figure 20-9 Results
- Click Export to save the results data to one of the following file types:
- CSV
- TSV
- JSON
- CFJSON
- XML
20.4.3 Debug
Follow these steps to use the Debug option:
- Click Debug to launch a complete debug listing:
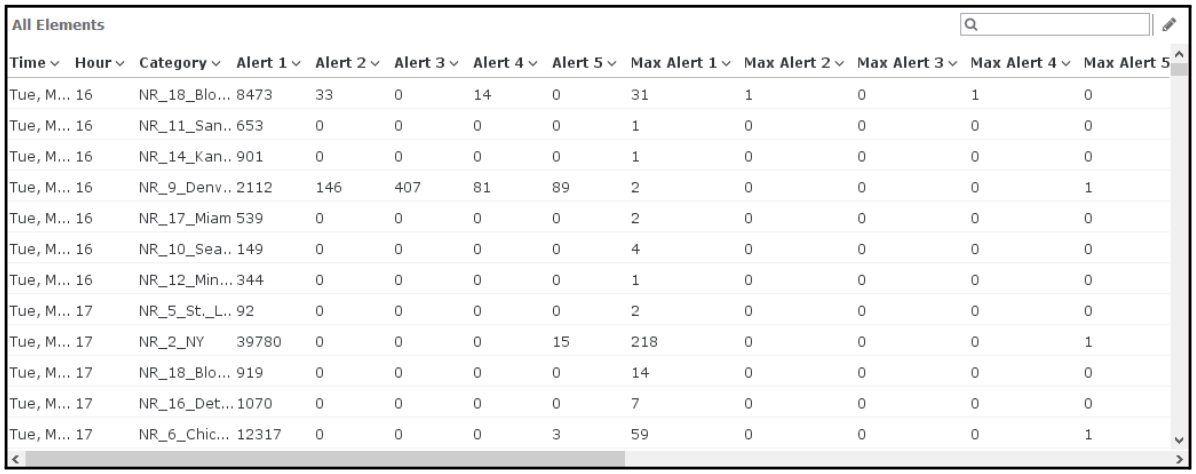
Figure 20-10 Debug Listing
- Select a debug listing line item and right click to display two options:

Figure 20-11 Debug Listing Options
| Option | Description |
|---|---|
| Copy to Clipboard | Select this option to copy the debug information to a clipboard for future use. |
| Export Table to CSV and Open | Select this option to copy the debug information to a CSV file and open it. |
Table 20-4 Debug Options
20.5 Configure
The Configure option allows you to:
- Start/Stop the RTCP Receiver.
- Automatically configure RTCP Categories.
- Enable/Disable Traces.
- Edit the RTCP Collector Port and IP Address.
- Edit the Default Codec.
- Enable/Disable the Hop Name Lookup.
- Enable/Disable Threshold Normalization.
- Enable/Disable use of the PQoS RTCP Remote Address.
- Enable/Disable sending PQoS RTCp via Agent/Controller connection.
Follow these steps to use the Configure option:
- Click Configure.
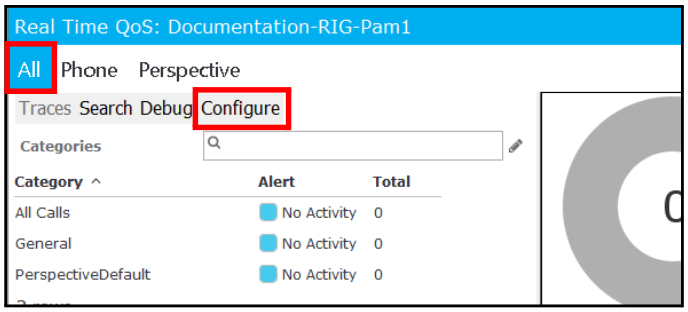
Figure 20-12 Configure
The Configure Real Time QoS - General window appears.
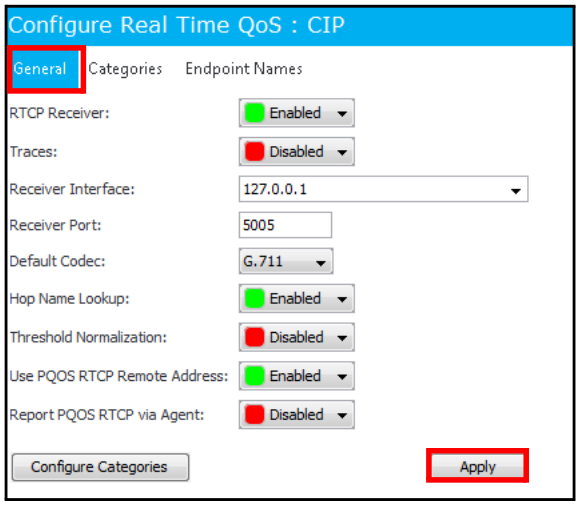
Figure 20-13 General
View a list of the Real Time QoS features.
- Turn on and off each feature, as needed, using the drop-down next to each feature.
| Feature | Description |
|---|---|
| RTCP Receiver | Set this to Enabled to enable RTCP. |
| Traces | Set this to Enabled to collect trace information. |
| Receiver Interface | Enter the RIG IP address. |
| Receiver Port | Leave the port as 5005. |
| Default Codec | Used to calculate the Mean Opinion Score (MOS) when sessions are encrypted, and the codec is not known to Nectar. If using encryption, set this to the codec that applies to the encrypted sessions. |
| Hop Name Lookup | Set this to Enabled to use DNS to show layer-3 device names in the trace routes in addition to their IP addresses. |
| Threshold Normalization | Select one of the following: • Enabled - When selected, each metric has a relative Y-axis scale with the maximum observed value becoming the maximum Y-axis value. This is the default value. Toggle between the absolute and relative Y-axis scales using the gear icon in the Real Time QoS Detail window. The maximum values are: - MOS=5 - RTD=500ms - Jitter=500ms - Loss=100% • Disabled - When selected, each metric in the Real Time QoS Detail window has its absolute Y-axis scale. |
| Use PQOS RTCP Remote Address | Default value is Enabled. |
| Report PQOS RTCP via Agent | Default value is Disabled. For more information, see Perspective Administration and User Guide. |
Table 20-5 Features
-
Click Apply.
-
Click Configure Categories.
The following message appears.
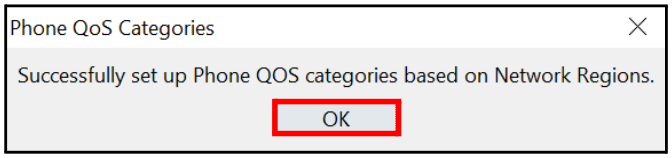
Figure 20-14 Configure Categories
- Click OK.
20.5.1 Categories
The Categories tab allows you to add, remove, enable, and disable QoS (and call detail) categories for monitoring and alerting. When Perspective Test IDs are added, the system automatically configures a category with the same name.
Follow these steps to use the Categories option:
- Click the Categories tab.
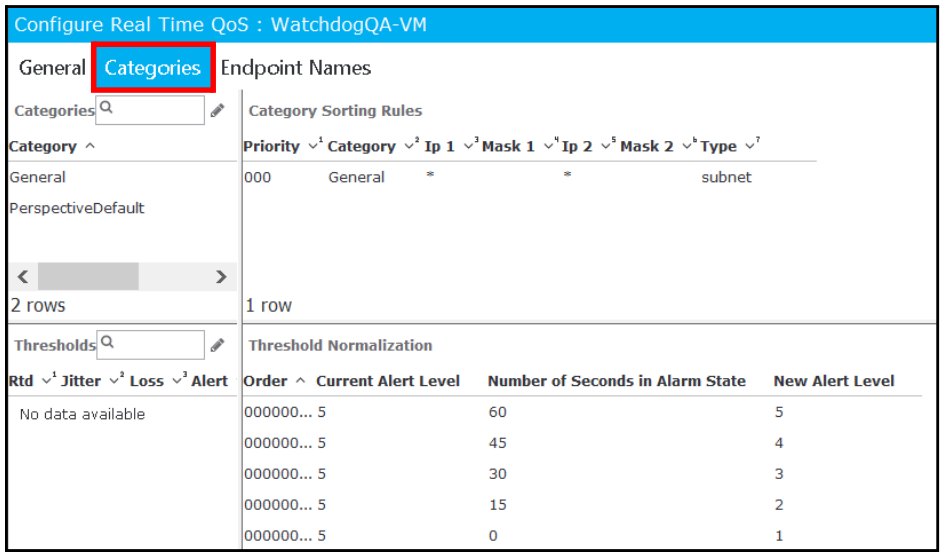
Figure 20-15 Categories Tab
- Right-click within the Categories pane and select one of these options:
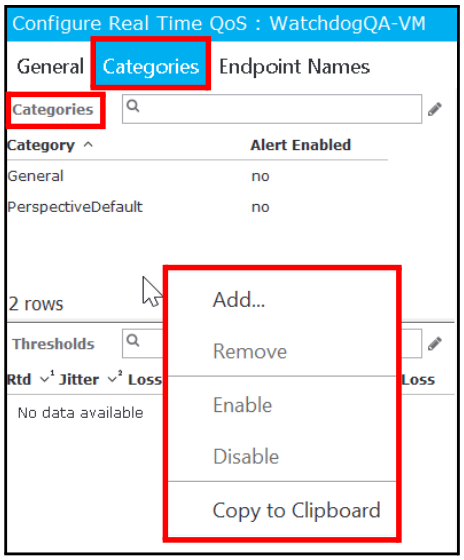
Figure 20-16 Category Setup Options
| Option | Description |
|---|---|
| Add |  Launches the Add Category window where you will enter a name for a new category. Launches the Add Category window where you will enter a name for a new category. |
| Remove | Permanently removes a category. |
| Enable | Enables alerting for a category. This changes the Alert Enabled column/status to yes. |
| Disable | Disables alerting for a category. This changes the Alert Enabled column/status to no. |
Table 20-6 Category Options
20.5.2 Category Sorting Rules Pane
Follow these steps to configure the category rules:
- Click the Categories tab.

Figure 20-17 Categories Tab
- Right-click in the Category Sorting Rules list to view a menu with these options:
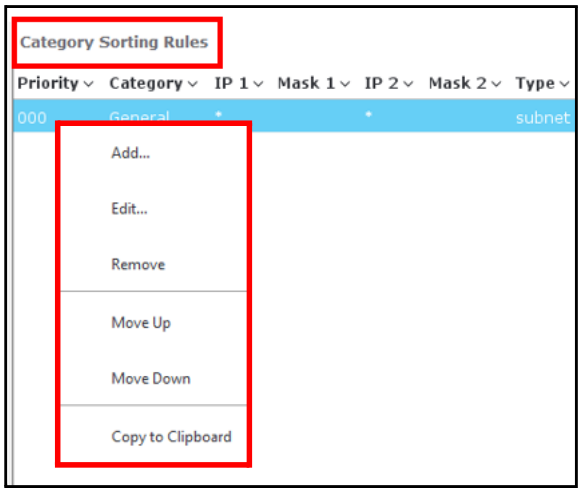
Figure 20-18 Category Sorting Rules Menu
| Option | Description |
|---|---|
| Add |  Select this option to add a new category sorting rule in the Add Category Rule window: Select this option to add a new category sorting rule in the Add Category Rule window: |
| Edit |  Highlight a category sorting rule; then select this option to edit the existing category sorting rule in the Edit Category Rule window: Highlight a category sorting rule; then select this option to edit the existing category sorting rule in the Edit Category Rule window: |
| Remove | Highlight a category sorting rule; then select this option to remove that category sorting rule. |
| Move Up | Highlight a category sorting rule to move it higher up in the rule hierarchy. |
| Move Down | Highlight a category sorting rule to move it lower down in the rule hierarchy. |
Table 20-7 Category Sorting Rules
The following rules apply to category sorting:
- If either side of a conversation matches an IP in the IP network range, it is included in the category.
- Category rules are processed in order.
- A pair of media streams is only associated with one matched category. In other words, no conversation will be in two categories.
The Category Sorting Rules list defines the categorization of new calls. You can define entries in this list by source, destination IP ranges (consisting of IP and Mask of the four octet form 000.000.000.000), and category. When a call is categorized, the system begins at the top of the list and checks each entry from top to bottom until a match is found.
The Category Sorting Rules can either be between endpoint or sequentially from one IP to another. Type determines whether it is a range of addresses (sequential) or from one endpoint to another (subnet or video endpoint). Wildcards can be used.
The endpoint enumeration of a sort entry is not tied to the position of a session's endpoints.
For example:
Category-General
- Type: Sequential, Subnet, or Video Endpoint
- Endpoint 1: 192.168.1.1/255.255.255.255
- Endpoint 2:192.168.1.2/255.255.255.255
This category matches either of the following sessions:
- IP: 192.168.1.1
- IP: 192.168.1.2
A category sort can also have the following values:
* : Any value matches this endpoint.
' ' (Empty Set): Only undefined endpoints are matched.
20.5.3 Thresholds Pane
The following metrics drive a threshold:
- Rtd (Round trip delay)
- Jitter
- Loss
- MOS (Mean Opinion Score)
- % Interval Loss
If a field is left blank, then it is ignored for purposes of matching a session. If any of these metrics are surpassed by a call session, then the call session will be considered to be at the alert level defined by the threshold.
If the Category corresponds to a Perspective Test ID, the threshold can be configured to apply to a codec type: audio, video or audio/video. By default, a threshold will apply to both.
Follow these steps to manage call detail thresholds:
- View the Thresholds pane in the bottom-left corner of the Configure Real Time QoS window:
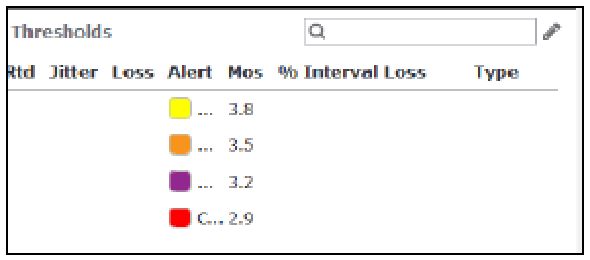
Figure 20-19 Thresholds for Category Alerts Pane
- Right-click in the Thresholds pane to display these menu options:

Figure 20-20 Threshold for Category Alerts Menu
| Option | Description |
|---|---|
| Add |  Select a category in the Categories pane. Right-click in the Thresholds pane and select this option to add a new threshold alert level for the selected category. Click OK. Select a category in the Categories pane. Right-click in the Thresholds pane and select this option to add a new threshold alert level for the selected category. Click OK. |
| Edit |  Select a category in the Categories pane. Right-click on a threshold for that category in the Thresholds pane and select this option to edit an existing threshold alert level for the selected category. Click OK. Select a category in the Categories pane. Right-click on a threshold for that category in the Thresholds pane and select this option to edit an existing threshold alert level for the selected category. Click OK. |
| Remove | Select a threshold; then select this option to remove it. |
| Copy Thresholds | Select this option to copy the thresholds from another category. |
Table 20-8 Thresholds
A session generated by Perspective mimics either an audio or video codec. For more information, see Perspective Administration and User Guide. Currently, only sessions for audio codecs will have MOS values calculated. If Perspective is configured to generate sessions for audio and video codecs, then it is recommended that two sets of thresholds are configured: one set for audio that contains MOS and the other set for video that uses other metrics for classification. As an example, refer to the following figure.
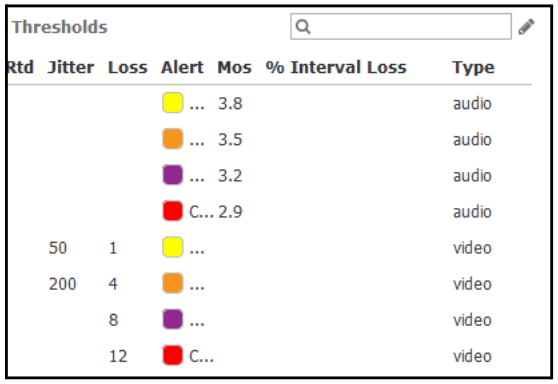
Figure 20-21 Threshold Type
20.5.4 Endpoint Names
The Endpoint Names tab allows you to add, edit, and remove endpoints on which to monitor Real Time QoS call data.
Follow these steps to use the Endpoint Names option:
- Click the Endpoint Names tab.
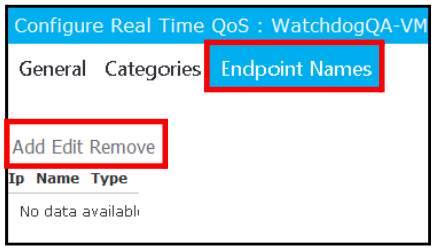
Figure 20-22 Endpoint Names
- Select one of the following:
| Option | Description |
|---|---|
| Add |  Launches the Add QoS Name window, where you can enter the IP address, Name, and Type of endpoint you are adding. Click OK when you are done. Launches the Add QoS Name window, where you can enter the IP address, Name, and Type of endpoint you are adding. Click OK when you are done. |
| Edit | Launches the Edit QoS Name window, where you can edit the IP address, Name, and Type of endpoint you are adding. Click OK when you are done. |
| Remove | Allows you to remove the endpoint from your RIG. |
Table 20-9 Endpoint Names
20.6 Media Processor - Search Filter Panel
The bottom-left pane of the Real-Time QoS window contains two views:

Figure 20-23 Media Processor Search Filter Pane
- Media Processor
- Search Filter
20.6.1 Media Processor
Select this to view these details:
- Alert: The alert status.
- IP: The IP address involved.
- Name: The name of the media processor.
- Total: The total number of alerts.
20.6.2 Search Filter
Select this to view to search by IP or Extension. Searches can also include wild cards (*). The search results are displayed in the Search For panel to the right. You can also filter by Timezone and Alert Level:

Figure 20-24 Search For Pane
20.7 View Call Detail Records
To access the Call Details Module, navigate to Health > Quality Management > Call Detail:
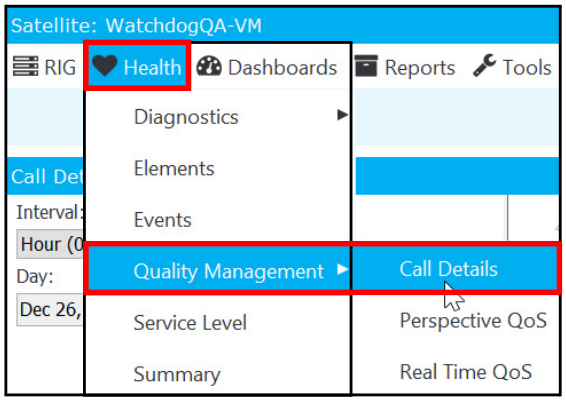
Figure 20-25 Health > Quality Management > Call Detail
The Call Details window appears.
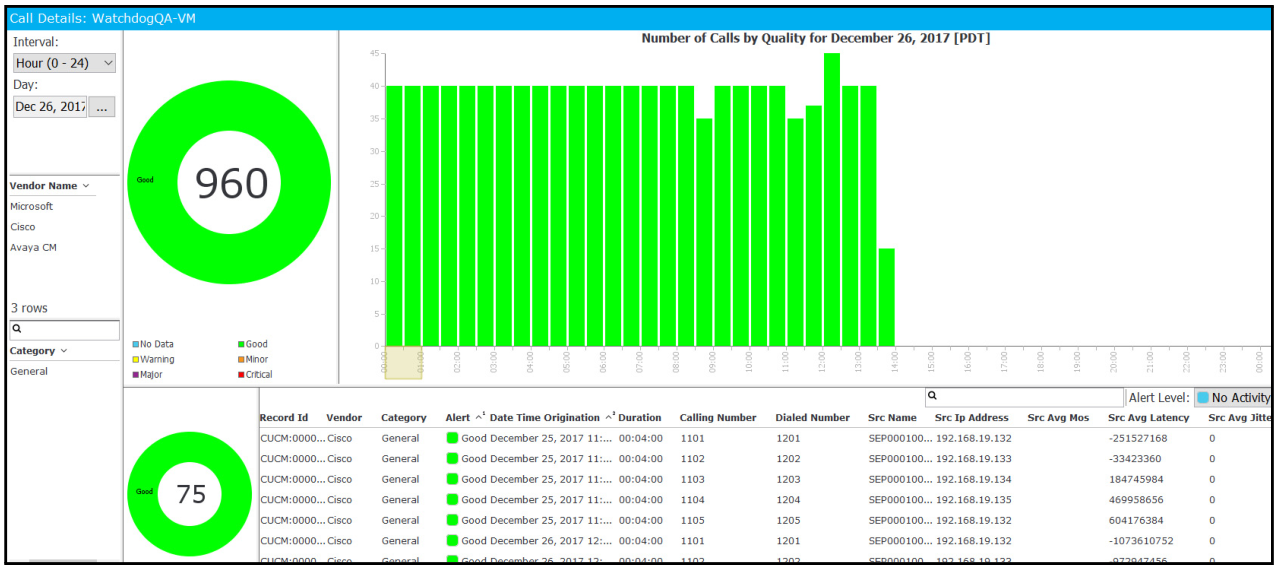
Figure 20-26 Call Details
20.7.1 Interval
The Interval pane allows you to adjust the interval for captured call detail information:
- Interval - You have three interval options:
| Option | Description |
|---|---|
| Hour (0-24) | Captures call details at every hour of the day. |
| Hour (6-18) | Captures call details for hours between the sixth and 18th hour of the day. |
| Week | Captures call details weekly. |
Table 20-10 Interval Options
- Day - You can select a specific date for captured call detail information. Use the ... button to the right of the displayed date to open a calendar window to help with your date selection.

Figure 20-27 Interval Pane
20.7.2 Vendor Name
The Vendor Name pane allows you to select the vendor whose call details you wish to view. Currently, Nectar supports Microsoft, Cisco, and Avaya CM Call Detail records.

Figure 20-28 Vendor Name
20.7.3 Category
The Category pane allows you to select the category for which you want to view Call Detail records.

Figure 20-29 Category
To configure Call Detail categories, see Configure Call Detail.
20.7.4 Call Status
The Call Status pane contains a total number of calls that are currently being tracked, and the calls are displayed in a pie chart. In this example, a total of 980 calls are occurring.
The Alert statuses are displayed in the legend at the bottom of the panel:
- No Calls
- Warning
- Major
- Good
- Minor
- Critical
Figure 20-30 Call Status
Hover over any status, such as Good, to view a tally of calls by status:

Figure 20-31 Call Status Detail
20.7.5 Number of Calls by Quality
The Number of Calls by Quality panel contains a graph that displays the number of calls by quality. In this example, the graph contains quality details for March 1, 2016:
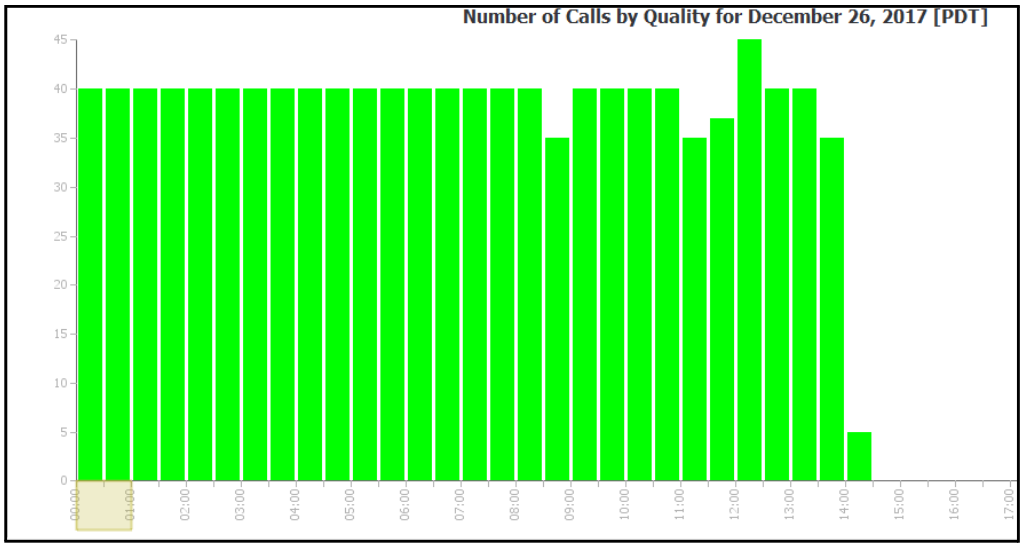
Figure 20-32 Number of Calls by Quality
Hover over any segment in the graph to view additional details:

Figure 20-33 Number of Calls by Quality: Additional Details
20.7.6 Call Details
The Call Details pane contains a list of call detail records with the following details:
- Vendor
- Category
- Alert
- Date Time Origination
- Duration
- Calling Number
- Dialed Number
- Src Name (Source Name)
- Src IP Address (Source IP Address)
- Src Avg Mos (Source Average Months)
- Src Average Latency (Source Average Latency)
- Src Average Jitter (Source Average Jitter)
- Src Average Loss Pct (Source Average Loss Percentage)
- Dst Name (Destination Name)
- Dst IP Address (Destination IP Address)
- Dst Leg ID (Destination Leg ID)
- Dst Average Mos (Destination Average Months)
- Dst Avg Latency (Destination Average Latency)
- Dst Avg Jitter (Destination Average Jitter)
- Dst Avg Loss Pct (Destination Average Loss Percentage)
- Date Time Termination

Figure 20-34 Call Details
You can also view call details for a certain Alert Level:

Figure 20-35 Alert Level
20.7.7 View Call Detail Records Forms
You can drill-down further and view Call Detail Record Forms pulled from the individual vendors. The fields and information displayed here vary greatly by vendor.
For more information on field definitions in these forms, search the vendor websites. For example, in our search, we found these informational links:
Cisco
- https://supportforums.cisco.com/document/53056/understanding-cdr-call-detail-records
Avaya
- https://downloads.avaya.com/css/P8/documents/100119783
Microsoft
- https://technet.microsoft.com/en-us/library/jj688079.aspx
Follow these steps to view Call Detail Record:
- In the The Number of Calls by Quality pane, slide the yellow bar to select a snapshot in time for which you want to view the Call Detail Record Form:

Figure 20-36 Number of Calls by Quality
This populates the Call Details pane.
- In the Call Details pane, right-click on a call and select View Details from the menu:

Figure 20-37 Select Call Details
The Call Detail Record appears. The records are extensive. Use the Scroll Bar to the right to scroll up and down through the record details.
View the following sample records by vendor.
Microsoft Example
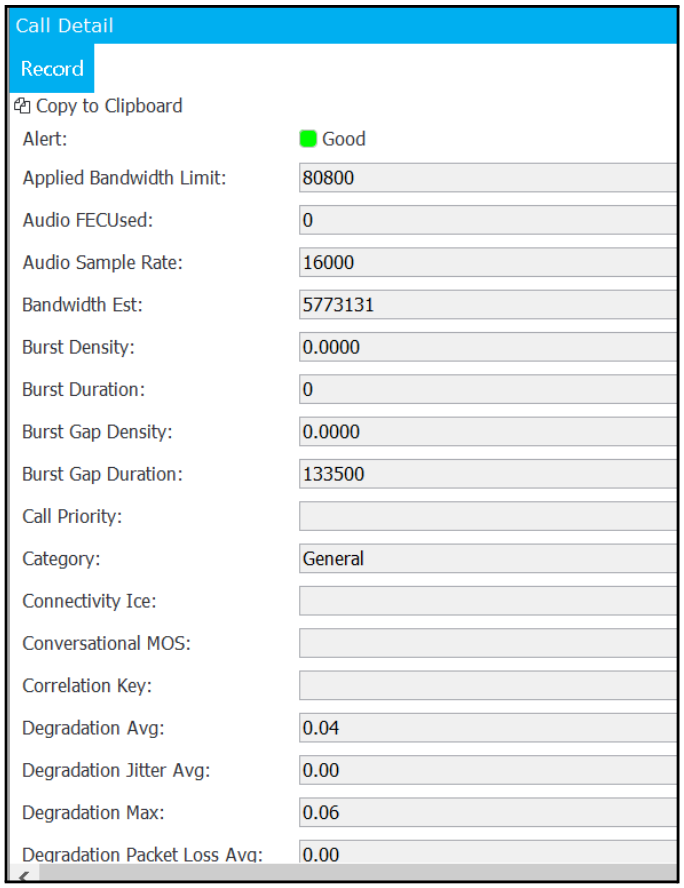
Figure 20-38 Microsoft Call Detail Record
Avaya Example
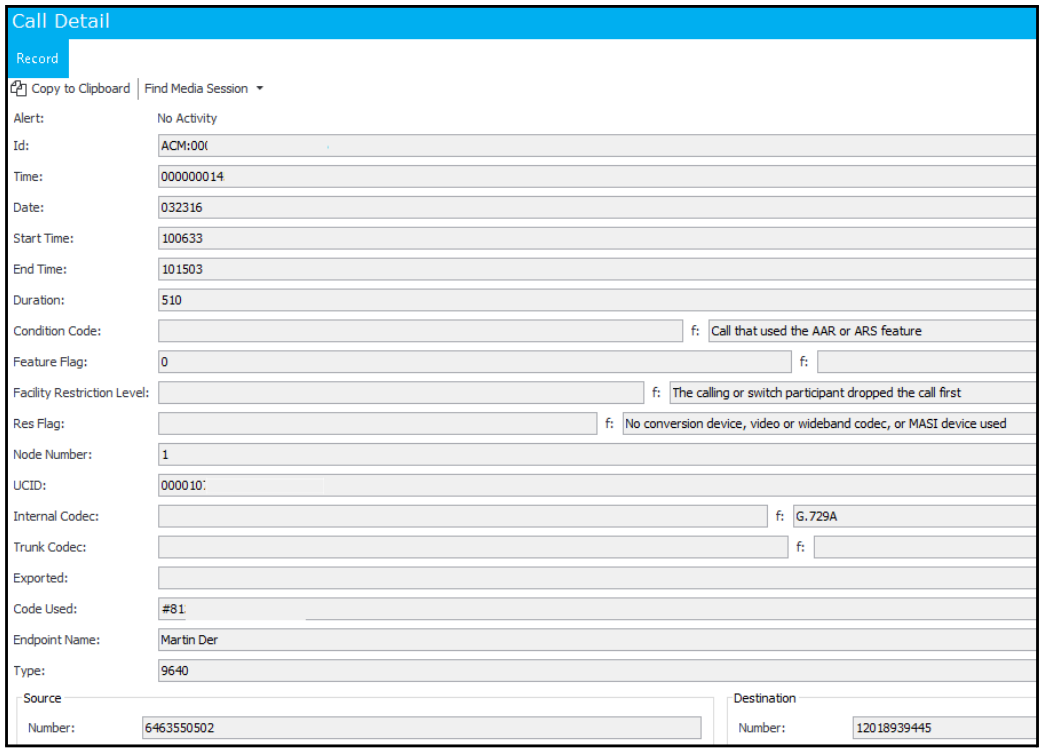
Figure 20-39 Avaya Call Detail Record Form
Cisco Example

Figure 20-40 Cisco Call Detail Record Form
20.7.8 Launch the Nectar Diagnostics Web Console
Nectar Diagnostics integrates RIGs with SfB services that capture data responsible for identifying the root causes behind SfB-specific UC problems.
Follow these steps to launch the Nectar Diagnostics web console:
- In the The Number of Calls by Quality, slide the yellow bar to select a snapshot in time for which you want to view diagnostics data:
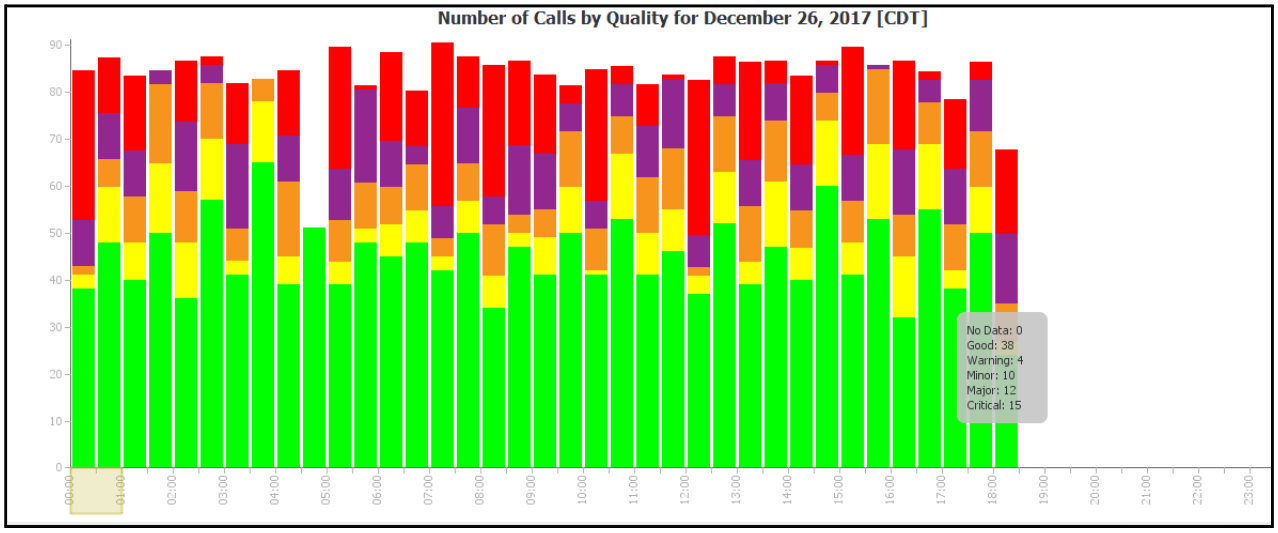
Figure 20-41 Number of Calls by Quality
This populates the Call Details pane with calls that were being tracked at the selected period of time.
- In the Call Details pane, right-click on a Microsoft call and select UCD Lookup from the menu:
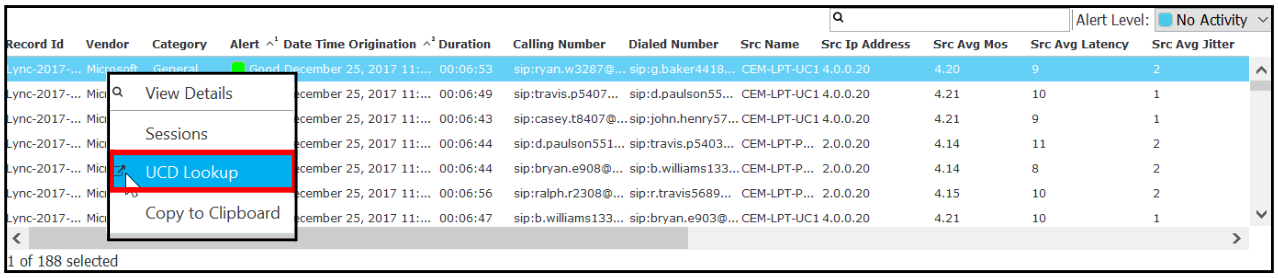
Figure 20-42 Select UCD Lookup
The Nectar Diagnostics Web Console launches:
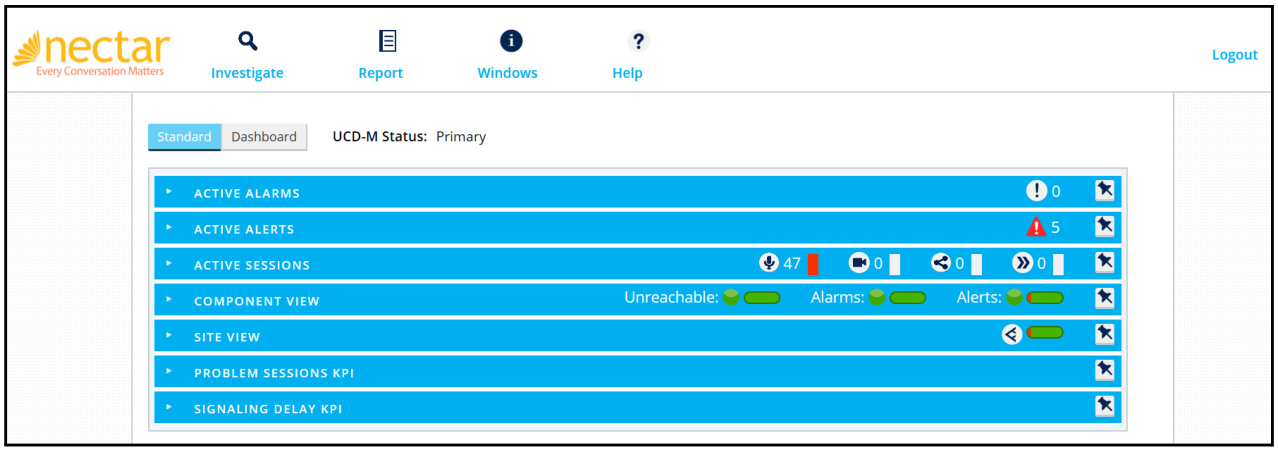
Figure 20-43 Nectar Diagnostics
- For more information, refer to the section in the Nectar Diagnostics User Guide. The interface you will be accessing is discussed in this guide.
20.7.9 Query for Quality of Sessions Records
Follow these steps to query for QSRs:
- In the The Number of Calls by Quality, slide the yellow bar to select a snapshot in time for which you want to view diagnostics data:
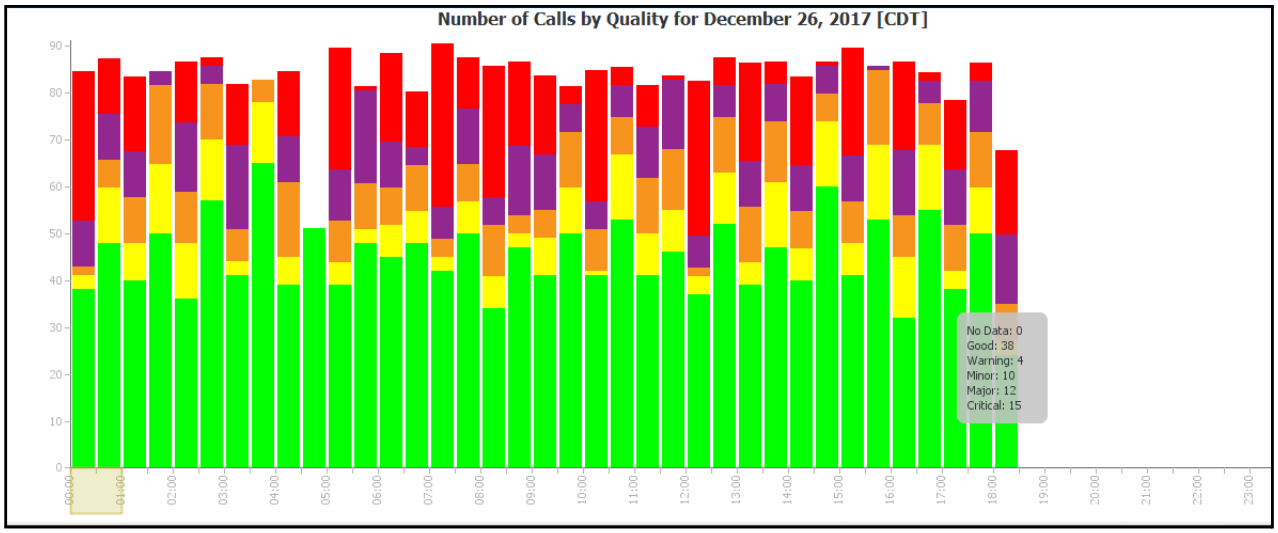
Figure 20-44 Number of Calls by Quality
This populates the Call Details pane with calls that were being tracked at the selected period of time.
- In the Call Details pane, right-click on a Microsoft call and select Sessions from the menu:
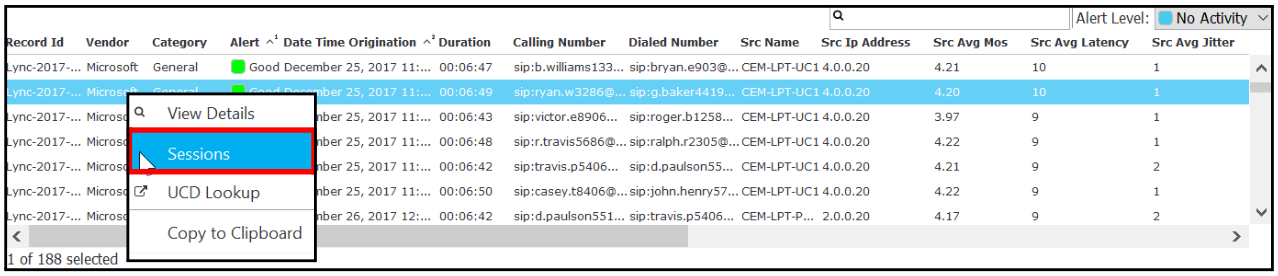
Figure 20-45 Sessions
The Sessions window appears.

Figure 20-46 Sessions
-
You can use the left pane of the Sessions window to query/search for Quality of Session Records (QSRs).
-
After you click Search, the record(s) appear in the right pane.
-
Right-click on a record and select View.
The Quality of Session Record window appears.
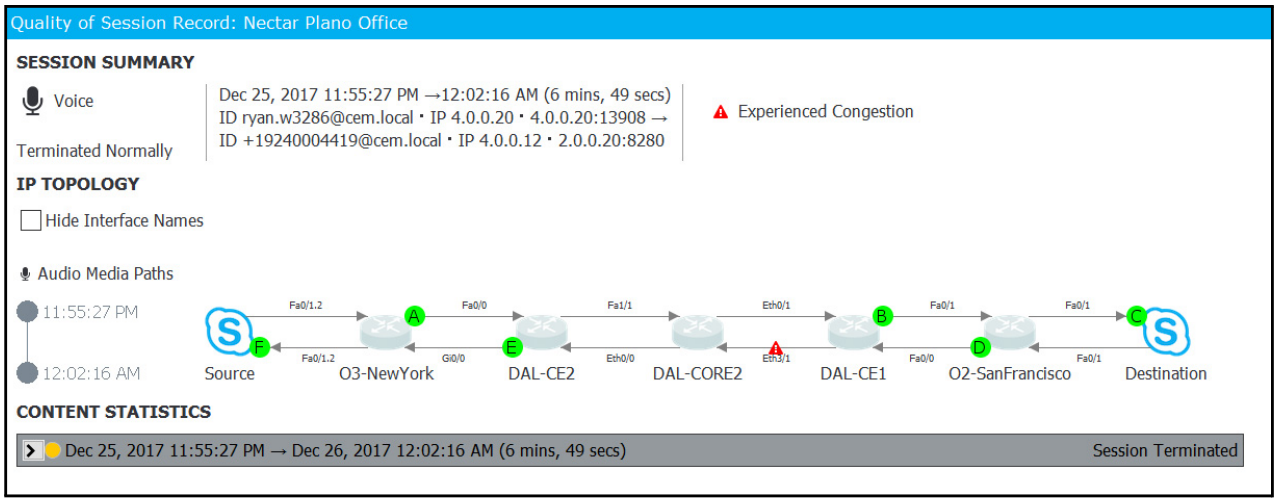
Figure 20-47 QSR
- For more information, refer to the section in the Nectar Diagnostics User Guide that discusses QSRs. The interface you will be accessing is discussed in this guide.
20.7.10 Search for Records
Some panes have Search fields where you can perform partial or complete text searches:
Figure 20-48 Search Fields
20.8 Configure Call Detail
Follow these steps to configure Call Detail module
- Navigate to Configure > Quality Management > Call Detail:
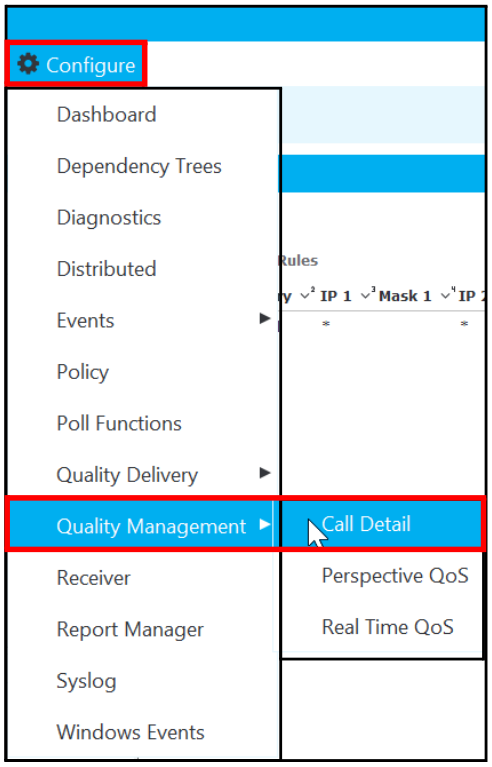
Figure 20-49 Configure > Quality Management > Call Detail
The Configure Call Detail window appears.
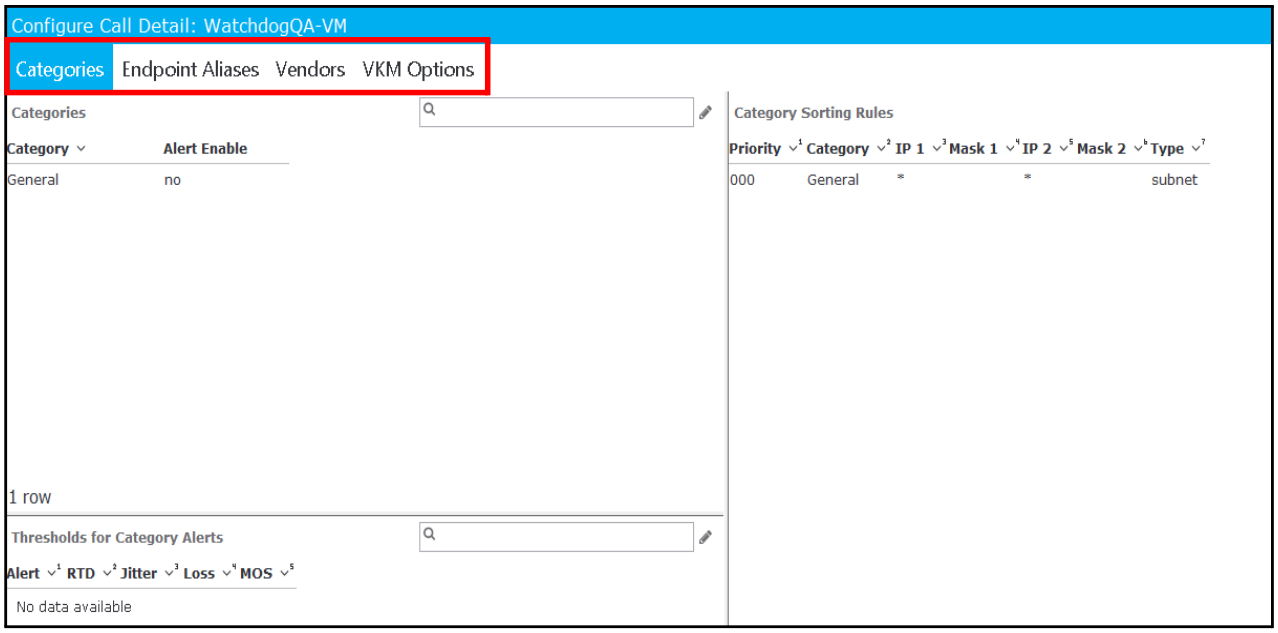
Figure 20-50 Configure Call Detail
View the following four options:
- Categories
- Endpoint Aliases
- Vendors
- VKM Options
20.8.1 Categories
The Categories pane allows you to configure call detail categories. For information, see Categories.
20.8.2 Endpoint Aliases
The Endpoint Aliases pane allows you to assign endpoint aliases to IP addresses:

Figure 20-51 Endpoint Aliases
Follow these steps to use the Endpoint Aliases option:
- Click Endpoint Aliases.
- Right-click within the Endpoint Aliases list to display a menu with these options:

Figure 20-52 Endpoint Aliases Menu
| Option | Description |
|---|---|
| Add |  Select this option to add a new endpoint alias. The Add Endpoint Alias window appears. Enter the IP address in the IP field, enter the alias name in the Alias field, and click OK. Select this option to add a new endpoint alias. The Add Endpoint Alias window appears. Enter the IP address in the IP field, enter the alias name in the Alias field, and click OK. |
| Edit |  Select this option to edit an existing endpoint alias and display the Edit Endpoint Alias window. Edit the IP address in the IP field, edit the alias name in the Alias field, and click OK. Select this option to edit an existing endpoint alias and display the Edit Endpoint Alias window. Edit the IP address in the IP field, edit the alias name in the Alias field, and click OK. |
| Remove | Highlight an endpoint alias; then right-click and select this option to remove it from the system. |
Table 20-11 Endpoint Alias
20.8.3 Vendors
The Vendors pane allows you to manage Call Detail vendors:

Figure 20-53 Vendors Tab
Follow these steps to use the Vendors option:
- Click Vendors.
- Right-click anywhere in the Vendors pane to display the following options:
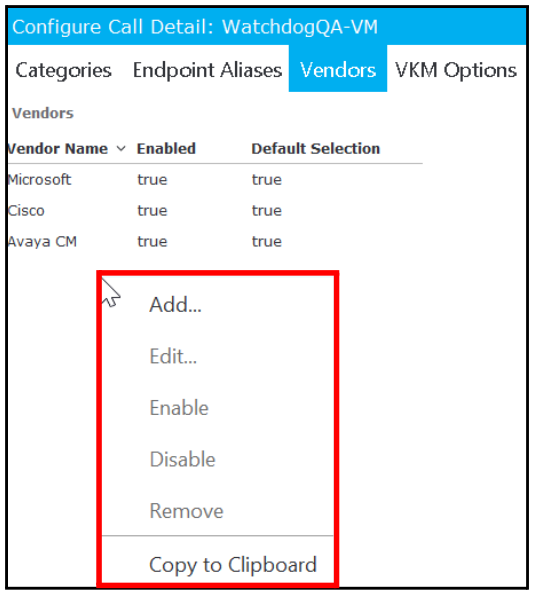
Figure 20-54 Vendors
| Option | Description |
|---|---|
| Add |  Select this option to open the Add Vendor window where you will add the following details; then click Save. Select this option to open the Add Vendor window where you will add the following details; then click Save.• Vendor Name - Enter the Vendor’s name, such as Cisco or Microsoft. • Module Name - Select the module name for which you will enable this vendor. • Enabled - Select this to enable the new vendor. • Default Selection - Select this check box to make this particular vendor your default vendor selection. The Default Selection column in the Vendors pane will be true when the vendor is the default selection. |
| Edit |  Select this option to open the Edit Vendor window (which contains the same fields as the Add Vendor window above) where you can edit vendor details; then click Save. Select this option to open the Edit Vendor window (which contains the same fields as the Add Vendor window above) where you can edit vendor details; then click Save. |
| Enabled | Select this check box to enable the vendor in the selected module. The Enabled column in the Vendor pane will be true when the vendor is enabled. |
| Disabled | Select this check box to disable the vendor in the selected module. The Enabled column in the Vendors pane will be false when the vendor is disabled. |
Table 20-12 Vendor Options
20.8.4 VKM Options
The VKM Options panel allows you to edit VKM options:

Figure 20-55 VKM Options
Follow these steps to use the VKM Options:
- Click VKM Options.
- Select a VKM option; then right-click and select Edit from the menu.
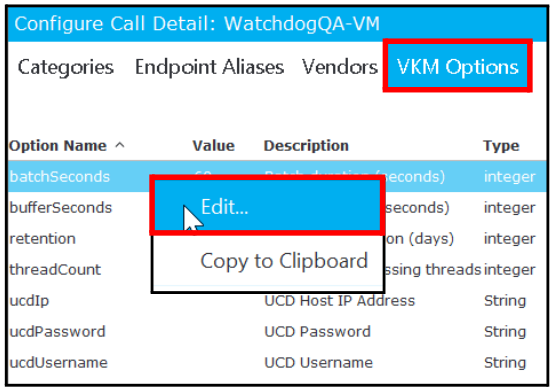
Figure 20-56 Edit VKM Options
The Edit VKM Options window appears. This window varies, depending on the VKM option that you select in the list.
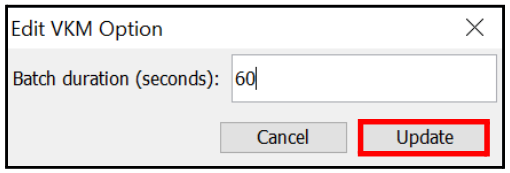
Figure 20-57 Edit VKM Option
- Make updates, as needed.
- Click Update to save your changes.
20.8.5 Configure Call Detail Category Sorting Rules
Follow these steps to configure Call Detail category sorting rules:
- Navigate to Configure > Quality Management > Call Detail.

Figure 20-58 Configure > Quality Management > Call Detail
- View the Category Sorting Rules pane, which contains these columns:
- Priority
- Category
- IP 1
- Mask 1
- IP 2
- Mask 2
- Type
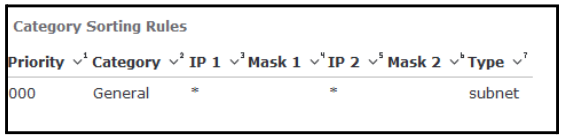
Figure 20-59 Category Sorting Rules
- Right-click in the Category Sorting Rules list to view a menu with these options:
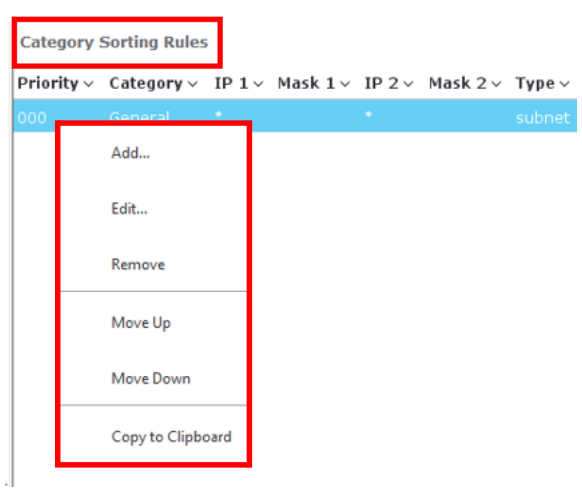
Figure 20-60 Category Sorting Rules Menu
| Option | Description |
|---|---|
| Add |  Select this option to add a new category sorting rule in the Add Category Rule window: Select this option to add a new category sorting rule in the Add Category Rule window: |
| Edit |  Highlight a category sorting rule; then select this option to edit the existing category sorting rule in the Edit Category Rule window: Highlight a category sorting rule; then select this option to edit the existing category sorting rule in the Edit Category Rule window: |
| Remove | Highlight a category sorting rule; then select this option to remove that category sorting rule. |
| Move Up | Highlight a category sorting rule to move it higher up in the rule hierarchy. |
| Move Down | Highlight a category sorting rule to move it lower down in the rule hierarchy. |
Table 20-13 Category Sorting Rules
20.8.6 Call Detail Thresholds Pane
The following three metrics drive a threshold:
- Rtd (Round trip delay)
- Jitter
- Loss
If any of these metrics are surpassed by a call session, then the call session will be considered to be at the alert level defined by the threshold.
Follow these steps to manage call detail thresholds:
- Navigate to Configure > Quality Management > Call Detail.
- View the Thresholds pane in the bottom-left corner of the Call Detail window:

Figure 20-61 Call Detail Category Alert Thresholds
- Right-click in the Thresholds panel to display these menu options:
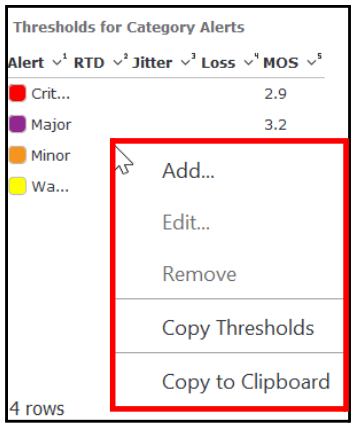
Figure 20-62 Threshold for Category Alerts Menu
| Option | Description |
|---|---|
| Add |  Select a category in the Categories pane. Right-click in the Thresholds pane and select this option to add a new threshold alert level for the selected category: Select a category in the Categories pane. Right-click in the Thresholds pane and select this option to add a new threshold alert level for the selected category: |
| Edit |  Select a category in the Categories pane. Right-click on a threshold for that category in the Thresholds pane and select this option to edit an existing threshold alert level for the selected category. Select a category in the Categories pane. Right-click on a threshold for that category in the Thresholds pane and select this option to edit an existing threshold alert level for the selected category. |
| Remove | Select a threshold; then select this option to remove it. |
| Copy Thresholds | Select this option to copy the thresholds from another category. |
Table 20-14 Thresholds
21. Nectar Diagnostics
Nectar Foundation APM has two primary components:
- Nectar Foundation
- Nectar Diagnostics
This section introduces, at a high level, the functionality and menu interactions within the user interface related to Nectar Diagnostics. For more complete information, see Nectar Diagnostics User Guide.
This section provides information on the following:
- Enable/Configure UC Diagnostics for a RIG
- Sessions
- KPI Results
- Monitored Paths
- Alerts
- Termination Reasons
- NetFlow
- QoS
- Interface Capture
21.1 Enable/Configure UC Diagnostics for a RIG
Before you can access Nectar Diagnostics features on a RIG, you must do the following:
-
Navigate to RIG > Module Configuration.
The Module Configuration window appears.
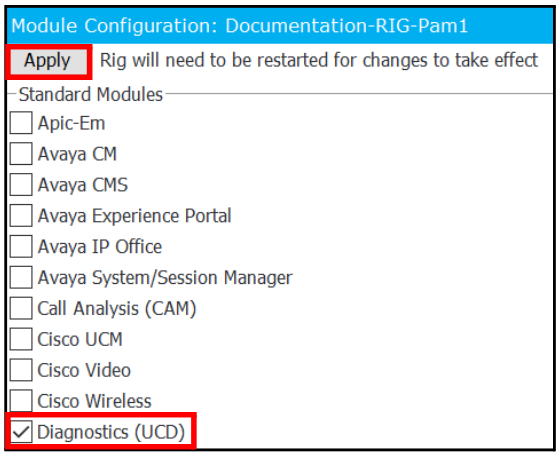
Figure 21-1 Enable Nectar Diagnostics
-
Select the Diagnostics (UCD) check box.
-
Click Apply.
-
To restart the RIG and apply the changes:
a. Navigate to RIG > Admin > Restart.
b. When the following message appears, click Yes.
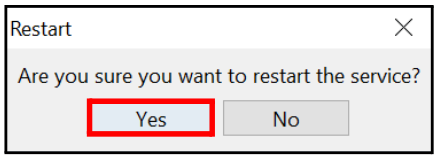
Figure 21-2 Restart
- After the RIG restarts, navigate to Configure > Diagnostics.

Figure 21-3 Configure > Diagnostics
The Diagnostics window appears.

Figure 21-4 Diagnostics
-
Click Add.
The Add Diagnostic window appears.

Figure 21-5 Add Diagnostic
- Enter the following values; then click OK:
| Parameter | Enter ... |
|---|---|
| Name | Name of the Nectar Diagnostics server. |
| Description | Description of the Nectar Diagnostics server. |
| UCD Server URL | Nectar Diagnostics server URL with which to connect, such as https:// xxx.xxx.xxx.xxx. |
| Username | Username associated with the server account. |
| Password/Confirm Password | Password associated with the server account and confirm. |
Table 21-1 Parameters
The new Nectar Diagnostics module should now connect to the Nectar Diagnostics server.
- Navigate to Health > Diagnostics to access this module.
Note: You can also navigate to Health > Quality Management > Call Details; right-click on a record and select UCD Lookup.
The following UCD Login window appears.
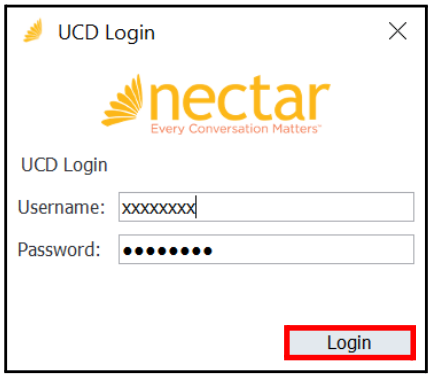
Figure 21-6 UCD Login
- Enter the Nectar Diagnostics Username and Password; then click Login.
21.2 Sessions
The Sessions feature is used to find the sessions based on session information, such as source of destination IP addresses or To and From IDs. The QSR record is created by the system for every session that is monitored.
Follow these steps to access this feature in Nectar Foundation APM:
- Navigate to Health > Diagnostics.
- Click Investigate and select Sessions.

Figure 21-7 Investigate > Sessions
The Sessions window appears.
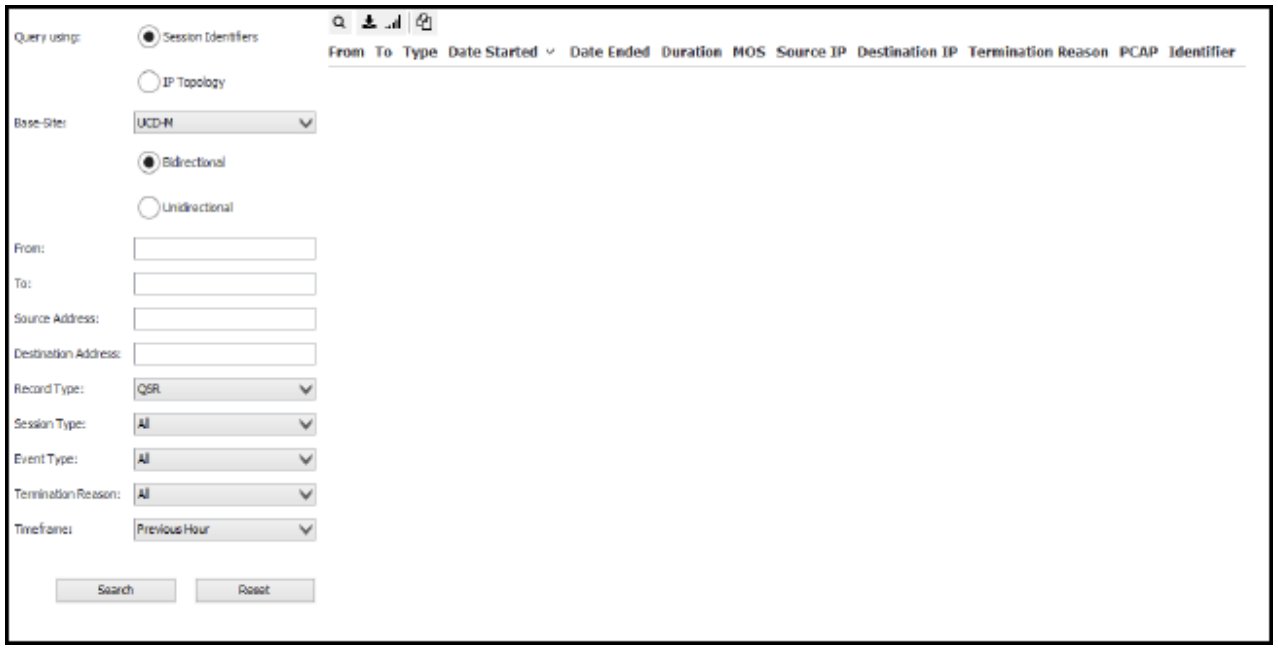
Figure 21-8 Sessions
-
Enter details in the Session Diagnostics window.
For detailed instructions on using the fields in this window, see the section entitled Sessions QSR Query in the Nectar Diagnostics User Guide.
21.3 KPI Results
The KPI Results allows you to view tabulated data for three groups of KPI metrics:
- Network Usage
- Problem Sessions
- Signaling Delays
Follow these steps to access this feature in Nectar Foundation APM:
- Navigate to Health > Diagnostics.
- Click Investigate and select KPI Results.
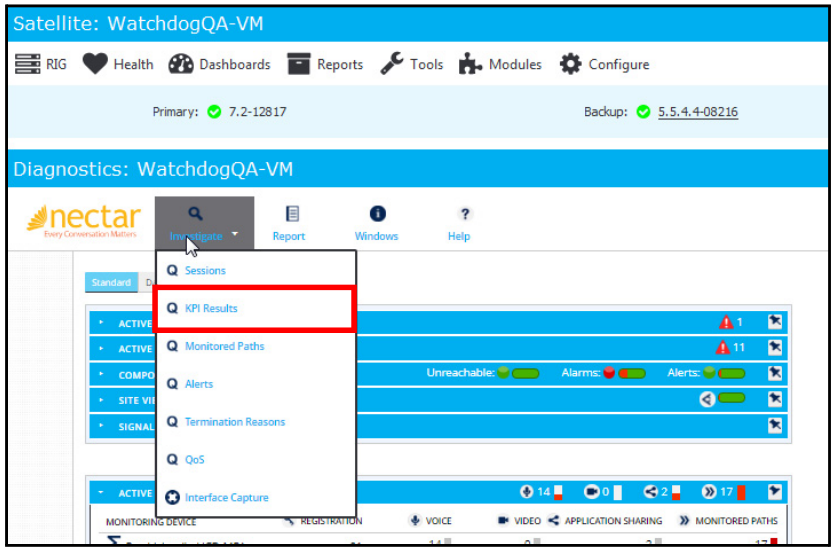
Figure 21-9 Investigate > KPI Results
The KPI Results window appears.
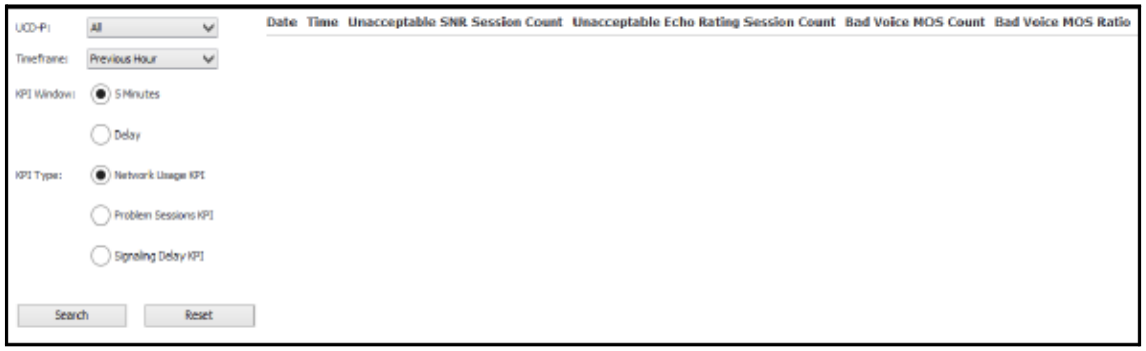
Figure 21-10 KPI Results
-
Enter details in the KPI Results window.
For detailed instructions on using the fields in this window, see the section entitled KPI Results Query in the Nectar Diagnostics User Guide.
21.4 Monitored Paths
The Monitored Paths feature defines a path between a source IP address and a destination IP address that the UCD-P then monitors as a permanent session. It displays the active and terminated monitored paths.
Follow these steps to access this feature in Nectar Foundation APM:
- Navigate to Health > Diagnostics.
- Click Investigate and select Monitored Paths.
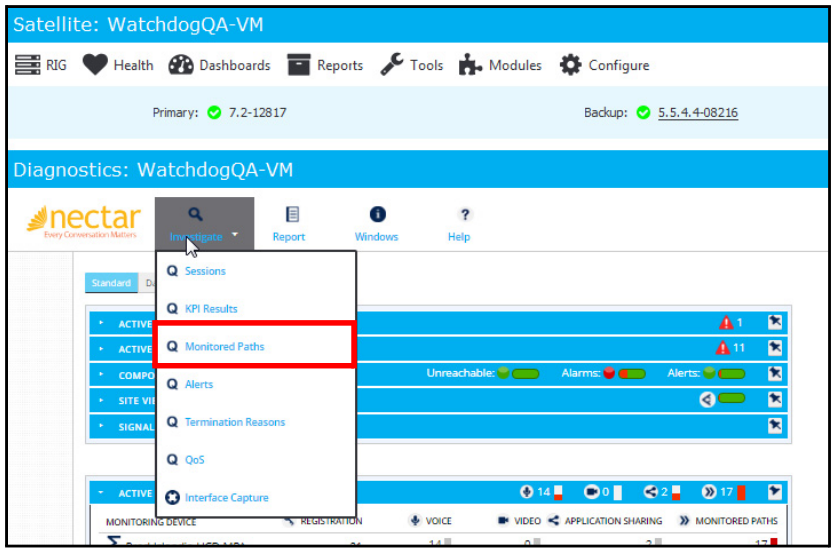
Figure 21-11 Investigate > Monitored Paths
The Monitored Paths window appears.

Figure 21-12 Monitored Paths
-
Enter details in the Monitored Path window.
For detailed instructions on using the fields in this window, see the section entitled Alerts Query in the Nectar Diagnostics User Guide.
21.5 Alerts
The Alerts feature displays the topology alerts that are detected in a given time period.
Follow these steps to access this feature in Nectar Foundation APM:
- Navigate to Health > Diagnostics.
- Click Investigate and select Alerts.
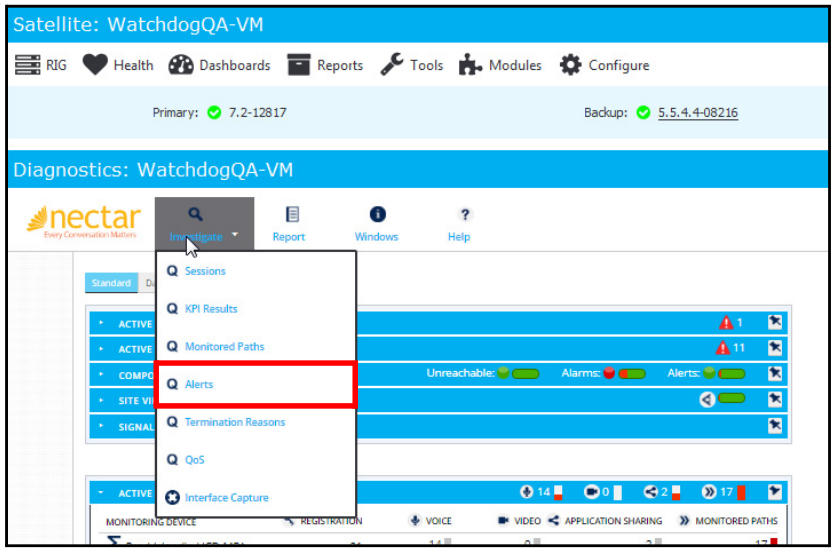
Figure 21-13 Investigate > Alerts
The Alerts window appears.
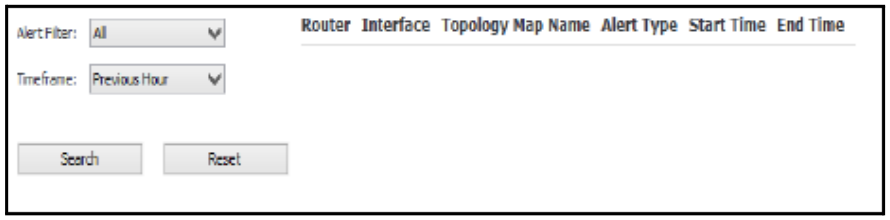
Figure 21-14 Alerts
-
Enter details in the Alerts window.
For detailed instructions on using the fields in this window, see the section entitled Alerts Query in the Nectar Diagnostics User Guide.
21.6 Termination Reasons
The Termination Reasons feature displays the topology alerts that are detected in a given time period.
Follow these steps to access this feature in Nectar Foundation APM:
- Navigate to Health > Diagnostics.
- Click Investigate and select Termination Reasons.
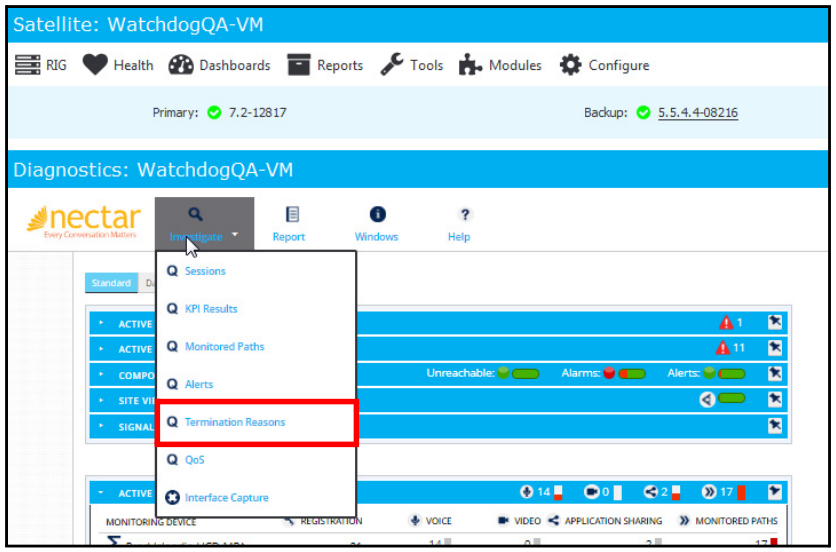
Figure 21-15 Investigate > Termination Reasons
The Termination Reasons window appears.
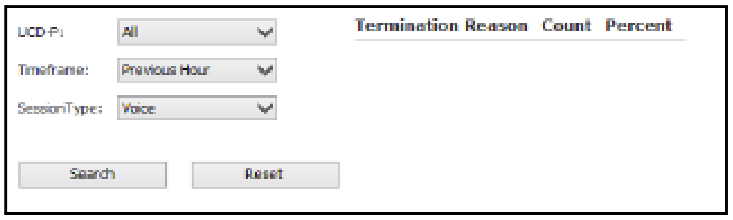
Figure 21-16 Termination Reasons
-
Enter details in the Termination Reasons window.
For detailed instructions on using the fields in this window, see the section entitled Termination Reasons Query in the Nectar Diagnostics User Guide.
21.7 NetFlow
The NetFlow feature allows you to configure UCD-Ps to poll the routers they are monitoring for NetFlow counters.
Follow these steps to access this feature in Nectar Foundation APM:
-
Navigate to Health > Diagnostics.
-
Click Investigate and select NetFlow.
The NetFlow window appears.
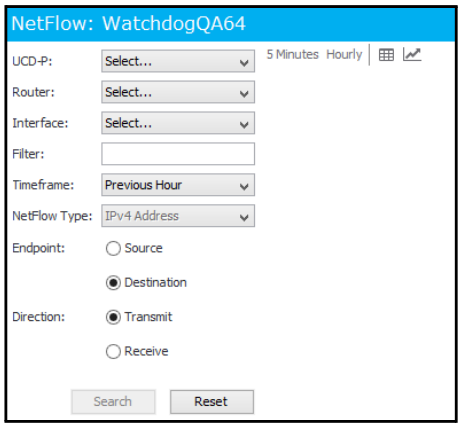
Figure 21-17 NetFlow
-
Enter details in the NetFlow window.
For detailed instructions on using the fields in this window, see the section entitled Netflow Data Query in the Nectar Diagnostics User Guide.
21.8 QoS
The QoS feature allows you to configure UCD-Ps to poll the routers they are monitoring for interface and Quality of Service (QoS) counters.
Follow these steps to access this feature in Nectar Foundation APM:
- Navigate to Health > Diagnostics.
- Click Investigate and select QoS.

Figure 21-18 Investigate > QoS
The QoS window appears.
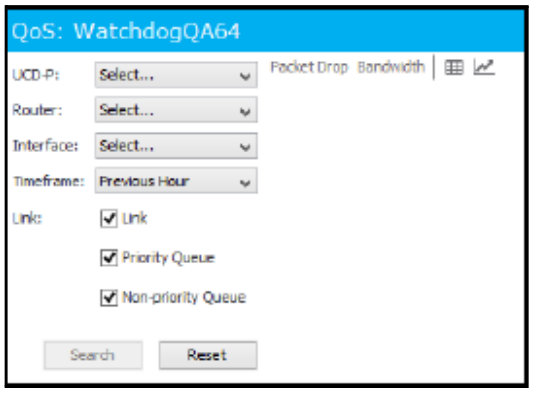
Figure 21-19 QoS
-
Enter details in the QoS window.
For detailed instructions on using the fields in this window, see the section entitled QoS Query in the Nectar Diagnostics User Guide.
21.9 Interface Capture
The Interface Capture feature allows for the capturing of PCAP data from any single XYXS interface on a UCD-A or UCD-P. Additionally, all XYXS interfaces can be captured on a UCD-P. A user must have Administrative privileges to perform this function.
Follow these steps to access this feature in Nectar Foundation APM:
- Navigate to Health > Diagnostics.
- Click Investigate and select Interface Capture.
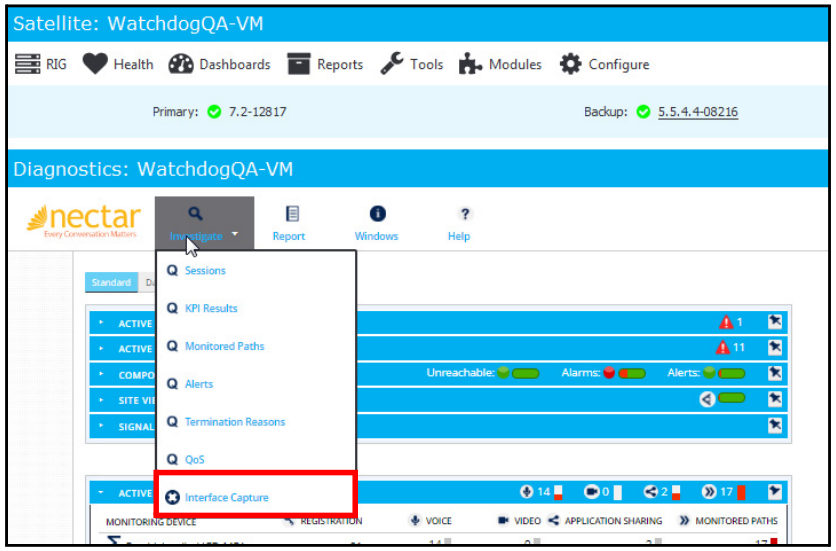
Figure 21-20 Investigate > QoS
The Interface Capture window appears.
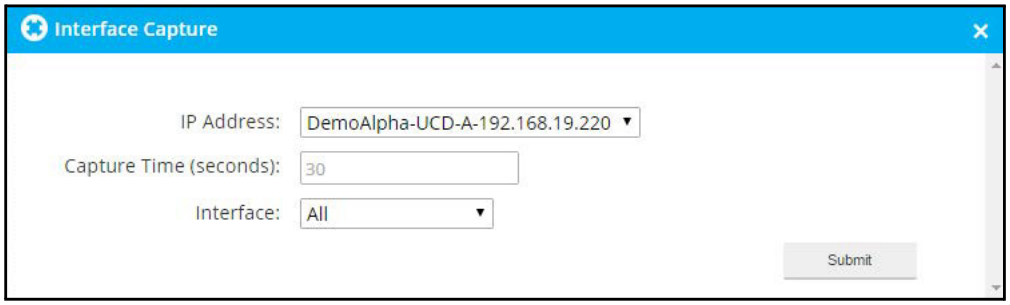
Figure 21-21 Interface Capture
-
Enter details in the Interface Capture window.
For detailed instructions on using the fields in this window, see the section entitled Interface Capture in the Nectar Diagnostics User Guide.
22. Configure Service Windows
Service Windows are used throughout the Nectar RIG client. For example, you can configure Service Windows for Perspective Schedules and Service Level Agreements (SLAs). You can configure Service Window exceptions so that, for example, the schedule stops during a specific time when maintenance is occurring on the system. You can also configure a schedule to run on certain hours, such as during business hours, and on certain days of the week.
To configure Service Windows, navigate to Configure > Quality Delivery > Service Window.
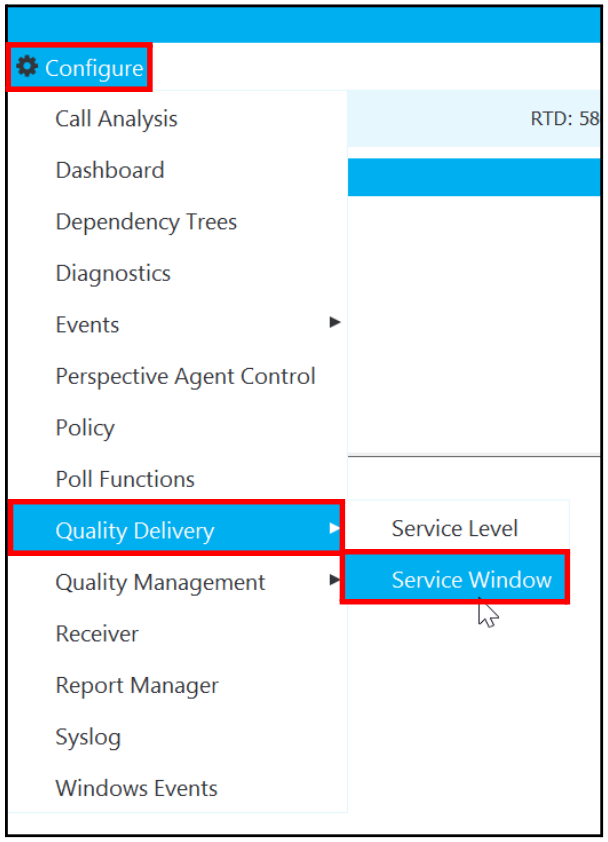
Figure 22-1 Configure > Quality Delivery > Service Window
The Service Window appears.
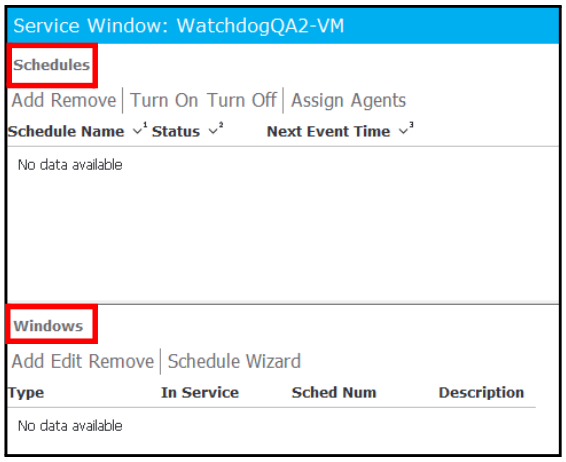
Figure 22-2 Service Window
22.1 Manage Schedules
The Schedules pane contains status details for each new and configured schedule.

Figure 22-3 Schedules
This section explains how to:
- Add a Schedule
- Remove a Schedule
- Activate/Inactivate a Schedule
- Assign Agent(s) to a Schedule
22.1.1 Add a Schedule
Follow these steps to add a new schedule name:
- From the Schedules pane, click Add.
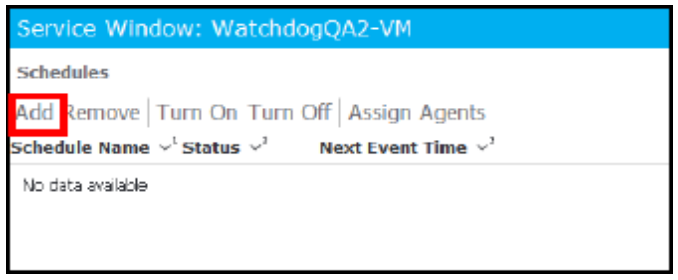
Figure 22-4 Add Schedule
The Add Schedule window appears.

Figure 22-5 Add Schedule
- Enter the name of the new schedule, such as 24x7.
- Click OK.
22.1.2 Remove a Schedule
Follow these steps to remove a schedule from the Schedules pane:
-
Select a schedule listed in the Schedules pane.
-
Click Remove.
The following message appears.
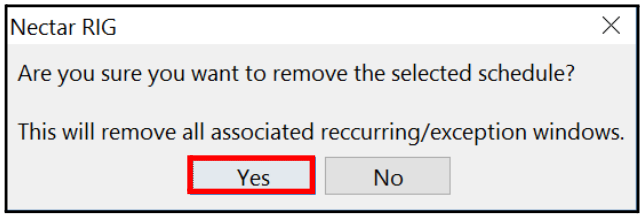
Figure 22-6 Add Schedule
- Click Yes to remove.
22.1.3 Activate/Inactivate a Schedule
Follow these steps to activate/inactivate a schedule listed in the Schedules pane:
- Select a schedule listed in the Schedules pane that shows off in the Status column.

*Figure 22-7 *
-
To activate, click Turn On.
The Status column changes to on, making it active.
-
Select a schedule listed in the Schedules pane that shows on in the Status column.
-
To inactivate, click Turn Off.
The Status column changes to off, making it inactive.
22.1.4 Assign Agent(s) to a Schedule
Follow these steps to assign an agent(s) to a schedule:
-
Select a schedule listed in the Schedules pane.
-
Clck Assign Agents.
The Assign Agents window appears.
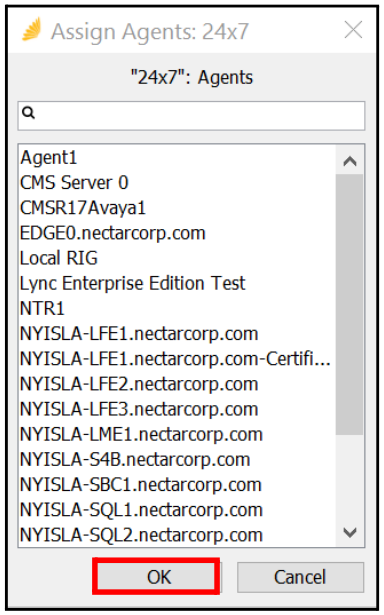
Figure 22-8 Assign Agents
- Select an agent(s) from the list to assign to the schedule; then click OK.
Note: You can use the Shift or Ctrl key to select more than one agent.
22.2 Manage Windows
The Windows pane provides status details for the Service Windows that are configured to be one of the following:
- Recurring Windows
- Exception Windows
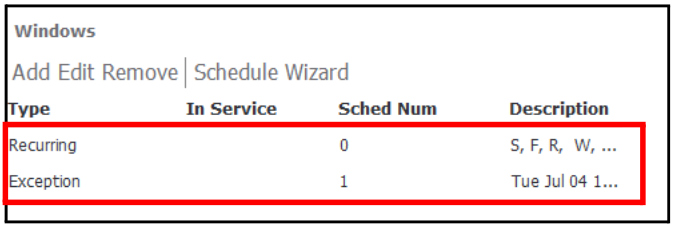
Figure 22-9 Windows
22.2.1 Recurring Windows
The Recurring window is configured to be recurring (ongoing) according to set parameters:
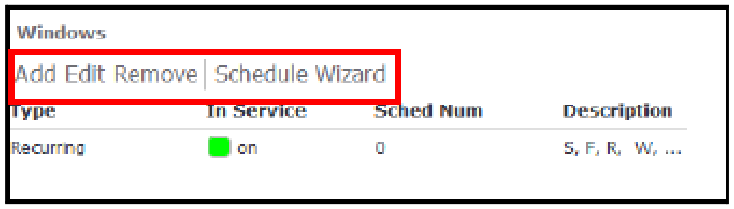
Figure 22-10 Recurring Windows Panel
This section explains how to:
- Add a Recurring Window
- Edit a Recurring Window
- Remove a Recurring Window
- Configure Schedule Details Automatically
Add a Recurring Window
Follow these steps to add a new Recurring Window and schedule:
-
Select a schedule in the Schedules pane.
-
From the Windows pane, click Add.
The Add Window window appears.
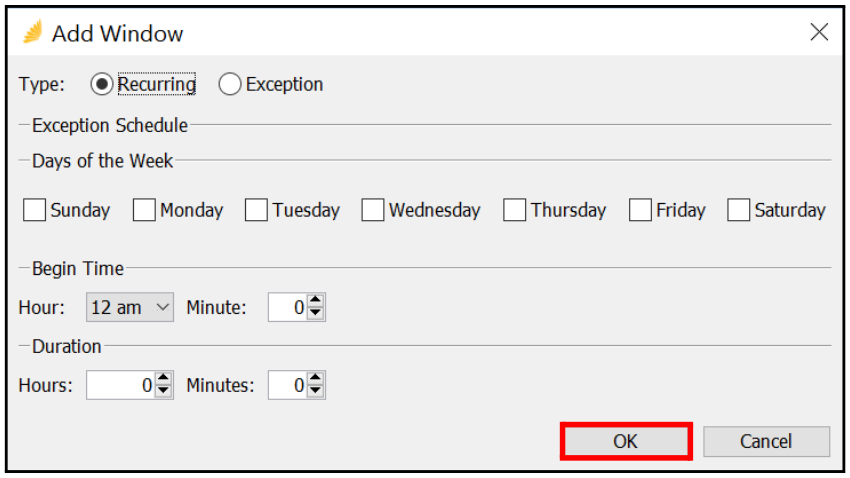
Figure 22-11 Add Window
- Enter the following information:
| Parameter | Description |
|---|---|
| Type | Select the Type as Recurring. The other option is Exception. For more information, see Exception Windows. |
| Days of the Week | Select the days of the week when this Recurring Window will be up and running. |
| Begin Time | Select the Hour of the day and the Minute when the Recurring Window will begin running on the selected days. |
| Duration | Select the duration when the Recurring Window will run in Hours and Minutes. |
Table 22-1 Parameters
- Click OK.
Edit a Recurring Window
Follow these steps to edit a Recurring Window and schedule:
-
Select a schedule in the Schedules pane.
-
Select a Recurring window listed in the Windows pane.
-
Click Edit.
The Edit Window dialog appears.

Figure 22-12 Edit Window
-
Make changes, as needed, to the recurring schedule:
- Days of the week when the schedule runs
- Begin time of the schedule
- Duration of the schedule
-
Click OK.
The Recurring window and schedule are updated with the new changes.
Remove a Recurring Window
Follow these steps to remove a Recurring window:
-
Select a Recurring window listed in the Windows pane.
-
Click Remove.
The following message appears.
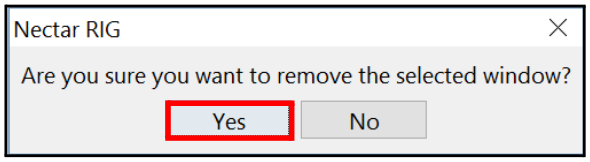
Figure 22-13 Remove
-
Click Yes.
The Recurring window is removed from the Windows pane.
Configure Schedule Details Automatically
Follow these steps to configure schedule details automatically:
- Select a schedule in the Schedules pane.
- Select a Recurring window listed in the Windows pane.
- Click Schedule Wizard.
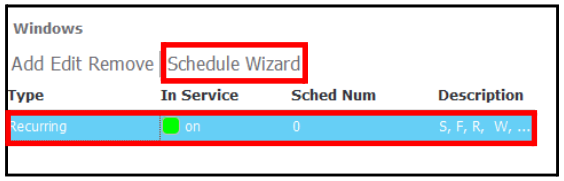
Figure 22-14 Schedule Wizard
The Schedule Wizard window appears.

Figure 22-15 Schedule Wizard
- You can use the Schedule Wizard to configure schedule details automatically rather than manually. This is useful when you need to create numerous schedules.
Note: If the Wizard is creating numerous schedule entries, it might take a while (up to 10 minutes) to populate the information.
-
When setting up a schedule using the Schedule Wizard, the Wizard assumes that you are starting the schedule at the 00:00 hour (midnight).
If you want the schedule to start at 00:30, for example, set the Offset from hour parameter to 30. The Wizard will run at 00:30 (or 12:30 am). You can offset this parameter up to 60 minutes.
- Click OK.
22.2.2 Exception Windows
The Exception window contains the details of an Exception configured to change a scheduled Recurring window. For example, a Recurring window may be set up to run Monday through Friday at a certain hour. However, on a particular day of each month you might configure an exception in which the Recurring window does not run.
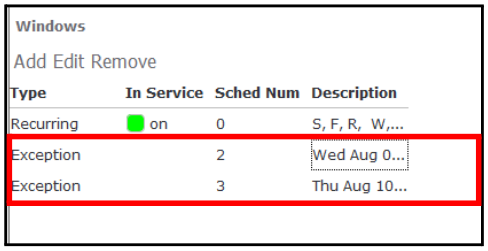
Figure 22-16 Exception Window
This section explains how to:
- Add an Exception Window
- Edit an Exception Window
- Remove an Exception Window
Add an Exception Window
Follow these steps to add an Exception window, which defines an exception to the schedule of a Recurring window:
-
Select a schedule in the Schedules pane.
-
From the Windows pane, click Add.
The Add Window window appears.

Figure 22-17 Add Window
- Enter the following information to create an Exception schedule:
| Parameter | Description |
|---|---|
| Type | Select the Type as Exception. The other option is Recurring. For more information, see Recurring Windows. |
| Start Date/Close Date/Time | Select the Start Date and Time and the Close Date and Time of the Exception schedule. |
| Days of the Week | Select the day(s) of the week when the Exception schedule runs. |
| Begin Time | Select the Hour of the day and the Minute when the Exception schedule begins running on the selected day(s). |
| Duration | Select the duration of the Exception schedule in Hours and Minutes. |
Table 22-2 Parameters
Note: In order for an Exception to run, the Exception schedule must be open and you must fill out the information in the Start Date/Close Date and Days of Week. For example, if you want to schedule an Exception every Saturday, be sure to set the Exception end date to a future date. Once this future date is reached, the Exception no longer occurs. You would still need to select Saturday and set the Begin Time and Duration on Saturday in order for that Exception to occur each week. Start Date/Close Date determine how long the Exception schedule continues. Days of the Week determine on which day(s) the Exception schedule runs.
-
Click OK.
The new Exception Window appears in the Windows pane.
Edit an Exception Window
Follow these steps to edit an Exception schedule:
-
Select a schedule in the Schedules pane.
-
Select an Exception window listed in the Windows pane.
-
Click Edit.
The Edit Window window appears.

Figure 22-18 Edit Window
-
Make changes, as needed, to the Exception schedule.
-
Click OK.
The Exception schedule is updated with the new changes.
Remove an Exception Window
Follow these steps to remove an Exception schedule:
-
Select a schedule in the Schedules pane.
-
Select an Exception window listed in the Windows pane.
-
Click Remove.
The following message appears.
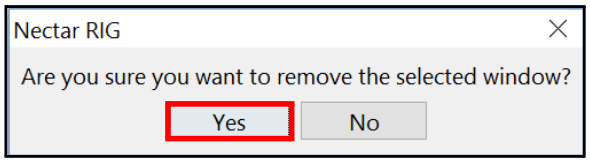
Figure 22-19 Remove
-
Click Yes.
The Exception window/schedule is removed from the Windows pane.
23. Service Level Agreements
A Service Level Agreement (SLA) is a contract between a service provider (either internal or external) and the end user that defines the level of service expected from the service provider. SLAs are output-based in that their purpose is specifically to define what the customer will receive.
The Nectar RIG provides customers with the ability to develop a variety of SLAs based on the services and commitments made to meet business demands. For example, a customer might have a contact center that is fully staffed from 9am to 5pm and partially staffed from 5-8pm. The customer might have two separate SLAs based on this setup. Because the customer is fully staffed from 9am to 5pm, they must have 100% availability of their phones, switches, and other devices during this time period to meet business SLAs. Anything that drops below this would break the SLA.
The customer could also set up a separate SLA from 5-8pm in which only 50% of their equipment must be up and running, because they are not fully staffed during these hours.
This section explains how to:
- View Service Level Information
- Configure Service Level Policies
- Configure Service Level Devices
- Edit SLA Impact Definitions
23.1 View Service Level Information
To view service level information for your RIG, navigate to Health > Service Level:

Figure 23-1 Health > Service Level
The Service Level window appears.
23.1.1 Service Level
The left Service Level pane contains the following information:

Figure 23-2 Left Service Level Pane
| Parameter | Description |
|---|---|
| Policy Name | Identifies the SLA policy name. |
| Enable | Indicates whether or not the policy is enabled: • Enabled = true • Disabled = false |
| Description | Describes the SLA policy. |
| Time Length | Specifies the length of time (in hours) in which the policy is in effect. This is a rolling time length, so if it is set for 24 hours, once that 24-hour period ends, a new 24 hour SLA will automatically start up. |
| Current Service Level | Provides the current service level of the SLA. In the example above, several SLAs have a current service level of 100. This means that devices are currently up and running at 100 percent. |
| Current Average | Provides the average service level of the SLA during the selected time period. |
| Schedule Name | If applicable, this is the name of the Service Window schedule that this SLA is running on. For more information on Service Windows, see Configure Service Windows. |
Table 23-1 Service Level Window
23.1.2 Service Level Graph
The Service Level graph appears in the right pane provides a visual current status and an average status of an SLA over a given time period.

Figure 23-3 Service Level Graph
The graph contains several buttons in the top right corner:
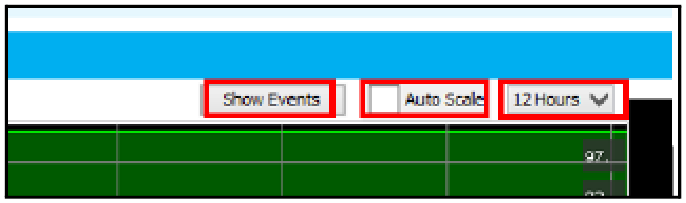
Figure 23-4 Service Level Graph Buttons
Refer to Table 23-2 for more information on these buttons.
| Button | Description |
|---|---|
| Show Events |  Click this button to view a detailed list of service level events. Right-click on an event in the list and select one of these options: Click this button to view a detailed list of service level events. Right-click on an event in the list and select one of these options:• Copy to Clipboard - Copies the event and its information to the clipboard for later use. • View Event - Vew the event details. • Goto Dependency - If the event was triggered by a Dependency Tree, this option displays that Dependency Tree. • Acknowledge - Acknowledges the event; clears the event, so that the issue will stop alerting. • Bookmark- Bookmarks the event for later reference. |
| Auto Scale | Click this check box change the graph to auto scale. |
| Hours |  Select a time range using the drop-down for viewing the status of an SLA: Select a time range using the drop-down for viewing the status of an SLA: |
Table 23-2 Service Level Graph Buttons
In the bottom right corner of the graph, a slider bar is available. You can slide it to the left to view more data in the graph. If the graph is set to 12 hours, it defaults to show the last two hours of activity. You can see previous activity by clicking the slider bar and sliding it to the left.
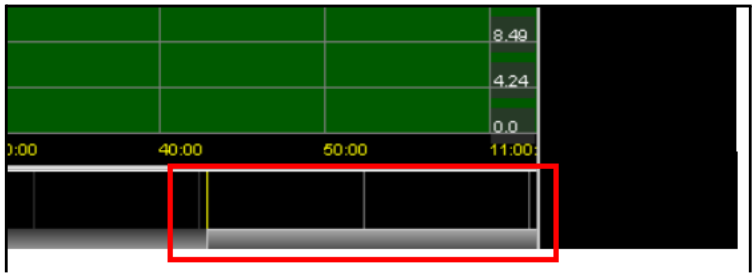
Figure 23-5 Graph Slider Bar
You can also scale in and view more details by sliding the yellow bar to the right:
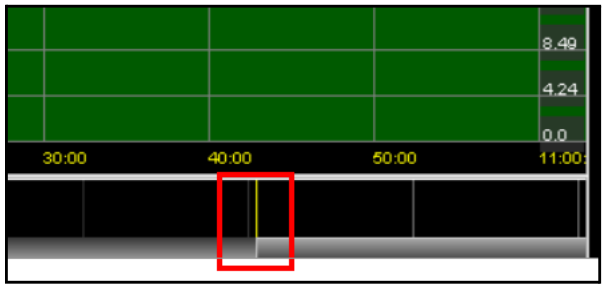
Figure 23-6 Graph Yellow Line
23.1.3 Levels
To the right of the graph, you can view a status for:
| Level | Description |
|---|---|
| Current Level | This is the level at which the SLA is currently set to at the current point in time that you are viewing it. In Figure 23-7, the SLA is 100 percent up and running |
| SLA Average | This is the average level of the SLA over a selected time period. In Figure 23-7, the SLA average is at 100 percent over the selected time period. |
Table 23-3 Levels

Figure 23-7 Levels
23.2 Configure Service Level Policies
To configure service level policies, navigate to Configure > Quality Delivery > Service Level:

Figure 23-8 Configure > Quality Delivery > Service Level
In the SLA Policies pane, right-click to view these menu options:
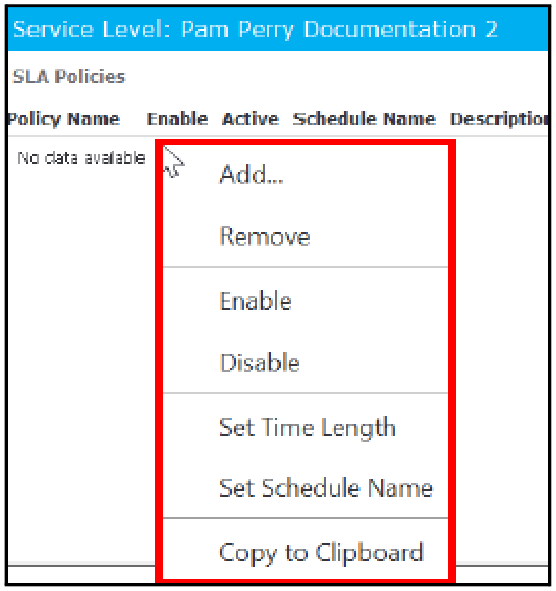
Figure 23-9 SLA Policies Menu
| Option | Description |
|---|---|
| Add |  Select this option to open the Add SLA Policy dialog box to create a new SLA Policy: Select this option to open the Add SLA Policy dialog box to create a new SLA Policy:• SLA Name - Enter a meaningful name for the SLA. • Length of Average (hours) - Enter the average length (in hours) in which the SLA policy will be in effect. • Enable Schedule - Select this check box to enable a schedule; then select the schedule in the drop-down to the right. Click OK. |
| Remove | Select a SLA Policy; then right-click and select this option to remove the SLA Policy from the system. |
| Enable | Select a SLA Policy; then right-click and select this option to enable the SLA Policy. The status changes to true in the Enable column. |
| Disable | Select a SLA Policy; then right-click and select this option to disable the SLA Policy. The status changes to false in the Enable column. |
| Set Time Length |  Select a SLA Policy; then right-click and select this option to open the Set Policy Time Length dialog box. Enter the Policy Time Length in hours; then click Update. Select a SLA Policy; then right-click and select this option to open the Set Policy Time Length dialog box. Enter the Policy Time Length in hours; then click Update. |
| Set Schedule Name |  Select a SLA Policy; then right-click and select this option to open the Set Schedule Name dialog box. Select a Schedule Name for the SLA Policy using the drop-down; then click OK. Select a SLA Policy; then right-click and select this option to open the Set Schedule Name dialog box. Select a Schedule Name for the SLA Policy using the drop-down; then click OK. |
Table 23-4 Service Level Options
23.3 Configure Service Level Devices
To configure service level devices, navigate to Configure > Quality Delivery > Service Level:
In the Devices pane, right-click to view these menu options:

Figure 23-10 Devices Menu
| Option | Description |
|---|---|
| Add |  Select a SLA Policy in the top pane; then right-click and select this option to open the Add Element Watch dialog box. To add a new SLA device to be monitored with this SLA (such as a PC, router switch, gateway, and so on), select an element in the list. The element will now appear in the Element Name field. Click OK. Select a SLA Policy in the top pane; then right-click and select this option to open the Add Element Watch dialog box. To add a new SLA device to be monitored with this SLA (such as a PC, router switch, gateway, and so on), select an element in the list. The element will now appear in the Element Name field. Click OK. |
| Remove | Select a device; then right-click and select this option to remove it. |
| Choose SLA Impact Definition |  Select a device; then right-click and select this option to open the Choose Service Level Definition dialog box to select a SLA impact definition. In the example, default is the only choice. You can also highlight a definition and click Edit to edit the definition. For more information, see Edit SLA Impact Definitions. Select a device; then right-click and select this option to open the Choose Service Level Definition dialog box to select a SLA impact definition. In the example, default is the only choice. You can also highlight a definition and click Edit to edit the definition. For more information, see Edit SLA Impact Definitions. |
Table 23-5 Devices
23.4 Edit SLA Impact Definitions
Follow these steps to edit a SLA impact definition:
-
Navigate to Configure > Quality Delivery > Service Level.
The Service Level window appears.
-
In the Devices pane, select a device; then right-click and select Choose SLA Impact Definition.
The Choose Service Level Definition dialog box appears.
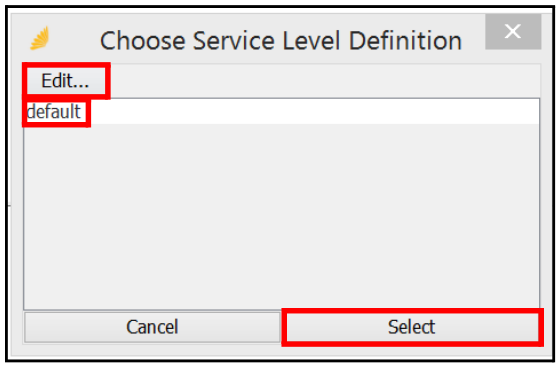
Figure 23-11 Choose Service Level Definition
-
Select a SLA Impact Definition.
In this example, default is the only choice.
-
Click Edit.
The Edit SLA Definitions window appears:

Figure 23-12 Edit SLA Definitions
- Right-click in the left pane to display a menu with these options:
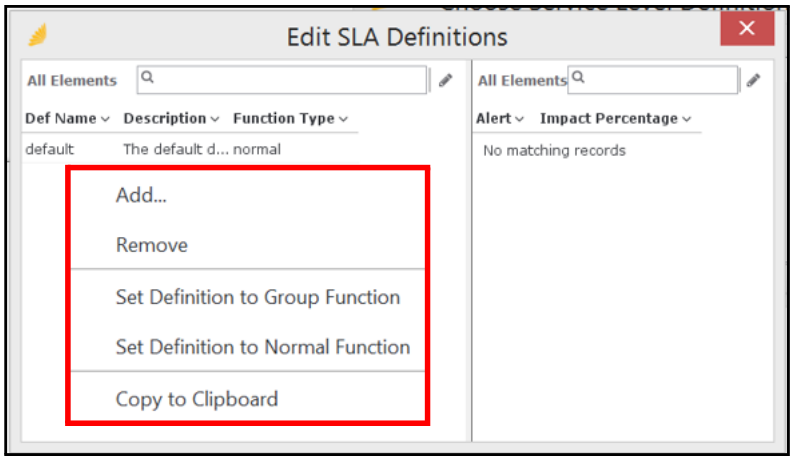
Figure 23-13 Edit SLA Definitions Menu
| Option | Description |
|---|---|
| Add |  Select this option to open the Add Impact Definition dialog box to add a new SLA Definition in the Edit SLA Definitions window. Enter a Definition Name; then click Create. Select this option to open the Add Impact Definition dialog box to add a new SLA Definition in the Edit SLA Definitions window. Enter a Definition Name; then click Create. |
| Remove | Select a definition; then right-click and select this option to remove it. |
| Set Definition to Group Function | Select a definition; then right-click and select this option to set the definition to a group type in the Function Type column. |
| Set Definition to Normal Function | Select a definition; then right-click and select this option to set the definition to a normal type in the Function Type column. |
Table 23-6 Edit SLA Definitions
- Right-click in the right pane to display a menu with these options:

Figure 23-14 Edit SLA Definition Menu
| Option | Description |
|---|---|
| Add |  This option allows you to set up a threshold for alerts/events at a percentage of your choosing. Right-click and select this option to open the Add SLA Definition Leg dialog box. Enter an Alert Level and Percentage Impact; then click Create. This option allows you to set up a threshold for alerts/events at a percentage of your choosing. Right-click and select this option to open the Add SLA Definition Leg dialog box. Enter an Alert Level and Percentage Impact; then click Create. |
| Remove | Select an alert and impact percentage; then right-click and select this option to remove it. |
Table 23-7 Alert and Impact Percentage
24. Policy Module
This section provides information about the following:
- Overview
- Configuration
- Policy Management
- Policy Editor
- Policy Node Menu Options
- Policy Node Types
- Policy Variables
- Boolean Tree Editor
24.1 Overview
The Nectar Foundation Policy Module can best be described as a graphical scripting utility that is mainly centered around Nectar Foundation events.
To access the Policy Module, navigate to Configure > Policy:
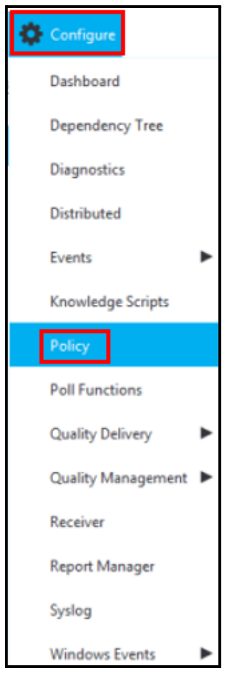
Figure 24-1 Configure > Policy
Note: If Policy is not listed under the Configure menu, see Configuration.
The Configure Policy window consists of two panels:
- The left-hand Policies panel is a filterable list of the existing policies, through which new policies can be added and existing policies can be changed.
- The right-hand panel is the Policy Editor, through which a selected policy can be changed by adding, editing, removing, and connecting policy nodes. You must double-click on a policy in the Policies panel to display the Policy Editor.

Figure 24-2 Policy Module Panels
Two types of policies exist, which are discussed in the following sections:
- Wait Policy Type
- Cycle Policy Type
Once created, each policy type contains a single node:
- A WAIT node is created for the Wait policy type.
- A START node is created for the Cycle policy type.
These and other node types are discussed later in this chapter.
24.1.1 Wait Policy Type
A Wait policy is primarily triggered by new events generated into the Event subsystem. It initially consists of a single WAIT node, which:
- Consists of multiple branches.
- Initially contains a single expiry branch, which will execute if an expire duration elapses prior to the execution of another branch.
Any number of other branches can be added, each with its own event query. The WAIT node branches can then be connected to other nodes to define one or more executions paths within the policy.
24.1.2 Cycle Policy Type
A Cycle policy is triggered on a cycle, the frequency of which is defined in the START node. The default frequency is 600 seconds (10 minutes).
24.2 Configuration
The Policy Module must be licensed and enabled before it is available for use. Once licensed, it can be enabled by navigating to RIG > Module Configuration. Select Policy under Premium Modules; then click Apply. Restart the RIG to apply the change.
24.3 Policy Management
As mentioned previously, the left-hand Policies panel is a filterable list of the existing policies. Through this list, a number of actions can be performed to create new policies or change existing policies. These actions are summarized here.
Select a policy in the Policies panel and right-click to display a menu, which contains these actions:
- Add
- Remove
- Enable
- Disable
- Advanced
- Rename
- Clone
- Dispatch
- Import
- Export
- Reset
- Remove Variables
- Copy to Clipboard

Figure 24-3 Policies Panel Menu Options
24.3.1 Add
The Add menu option is used to add a new policy.
Selecting this menu opens the Add dialog, which defaults to the Wait policy type.
Enter a unique name for the policy in the Policy Name field and then click Add.
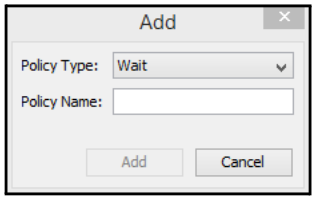
Figure 24-4 Add Dialog
24.3.2 Remove
The Remove menu option is used to remove one or more policies.
Selecting this menu option opens the Remove Policy Confirmation dialog, which allows you to confirm removal of the selected policies. The policies are removed after your confirmation.
This menu option is only available when one or more policies are selected in the Policies panel.
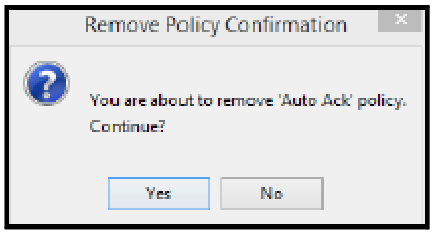
Figure 24-5 Remove Policy Confirmation
24.3.3 Enable
The Enable menu option is used to enable one or more policies.
Select the policies you want to disable, right-click, and select Enable from the menu.
The policies are enabled and the Enabled column changes to Yes.
This menu option is only available when one or more policies are selected in the Policies panel.
24.3.4 Disable
The Disable menu entry is used to disable one or more policies.
Select the policies you want to disable, right-click, and select Disable from the menu.
The polices are disabled and the Enabled column changes to No.
This menu option is only available when one or more policies are selected in the Policies panel.
24.3.5 Advanced
The Advanced menu option contains additional menu options, which are discussed here.
Rename
The Rename menu option is used to rename a selected policy.
Selecting this menu option opens the Rename dialog where you can rename the policy.
Enter the new name of the policy in the Policy Name field and click Rename.

Figure 24-6 Rename
This menu option is only available when one or more policies are selected in the Policies panel.
Clone
The Clone menu option is used to clone a selected policy.
Selecting this menu option opens the Clone dialog where you can enter a unique name for the cloned policy.
Cloning duplicates all of the configuration for the selected policy into a new policy with the specified name.
This menu option is only available when a single policy is selected in the Policies panel.
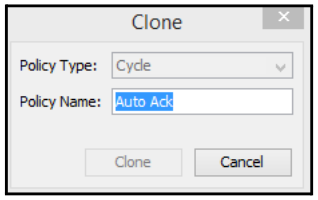
Figure 24-7 Clone Dialog
Dispatch
The Dispatch menu option is used to dispatch (or manually trigger) any selected Cycle policies. This is useful when building a new Cycle policy or to perform a single manual execution of a a Cycle policy.
This menu option is only available when one or more Cycle policies are selected in the Policies panel.
Import
The Import menu option is used to import one or more policies that were previously exported. It prompts for a file containing the exported policies and attempts to import them.
Imported policies with unique names cannot be imported as-is, but imported policies with names conflicting with existing policy names will trigger prompting to specify unique names.
Export
The Export menu option is used to export the selected policies. It prompts you for a file location and name and then exports the selected policies to that location and file.
This menu option is only available when one or more policies are selected in the Policies panel.
Reset
The Reset menu option is used to reset selected policies. It attempts to reset the selected policies’ internal state by performing some internal cleanup tasks and then forcing the polices into the disabled state.
This can be useful when a policy fails, which is most likely to happen when initially creating and/or testing a policy.
Failures occur mostly due to errors in the policies themselves introducing when editing/ building the policies. But failures can also occur externally, particularly when using the ComStruc Call or Script Call nodes to call an external Groovy script, for example. The Policy Module is implemented in such a way that it can detect and handle some errors occurring externally, but it cannot detect and handle them all.
In most cases, the Reset advanced pop-up menu entry can be used to reset and restore a policy to a clean state, from which is can be edited and tested further. However, in some cases, a failed policy may require a restart of the Nectar Foundation service before it can execute again. A restart may also be required if a policy attempting to call an external Groovy script fails, which can in some cases leave the Groovy Script Engine itself in a corrupt state. If this occurs, it can affect not only the failed policy, but also any other policy which utilizes Groovy scripts, as well as the Knowledge Script VKM itself (which provides the mechanism for calling Groovy scripts), and the only recourse to reset the Knowledge Script VKM and its Groovy Script Engine is to restart the Nectar Foundation service.
This menu option is only available when one or more policies are selected in the Policies panel.
Remove Variables
The Remove Variables menu option is used to clear all of the selected policies’ internal variables. It is useful when building a policy to set the policy’s variables to a clean/clear state.
This menu option is only available when one or more policies are selected in the Policies panel.
24.3.6 Copy to Clipboard
The Copy to Clipboard menu appears in most Nectar Foundation menus. It effectively copies all of the policy list content, including the header row, to the clipboard.
- If no existing policy is selected, it will copy all of the policies from the list to the clipboard.
- If one or more policies are selected, it will copy only the selected policies from the list to the clipboard.
Once copied, these can be pasted into another application as text.
24.4 Policy Editor
The right-hand pane of the Configure Policy dialog is the Policy Editor. It provides an interface to graphically build and modify a policy.
When you left-click on an existing node, a policy node menu appears containing information relating to the selected node along with entries that you can modify, such as connections from the associated node to other nodes.

Figure 24-8 Policy Node Menu
A policy node menu can contain any of the following menu options (depending on the node).
- Edit
- Copy
- Remove Node
- Next
- Continue
- for Each Match
- Time Expired
- “branch”
These menu options are discussed in Policy Node Menu Options.
24.5 Policy Node Menu Options
The policy node menu options, which are described in this section in detail.
24.5.1 Edit
The Edit menu option is used to edit the actual node. When you select this option, a dialog appears depending on the selected node type. The following is an example of the Edit Start Node dialog:
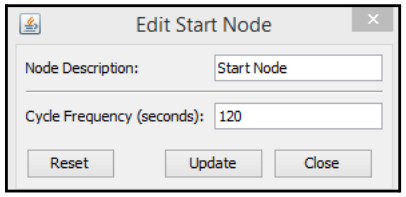
Figure 24-9 Edit Start Node
24.5.2 Copy
The Copy menu option is used to copy the selected node.
This menu option is not available on the initial/default WAIT node of a Wait policy nor on the initial/default START node of a Cycle policy.
Once copied, you can paste the node as a new node into the existing policy or another policy on the same RIG.
24.5.3 Remove Node
The Remove menu option is used to remove the selected node.
This menu option is not available on the initial/default WAIT node of a Wait policy nor on the initial/default START node of a Cycle policy.
When removed, any other nodes that connected to the removed node or that were connections from the removed node are updated to reflect the node removal (in other words, any affected connections are reset).
24.5.4 Next
The Next connection is available on all node types except WAIT, IF, and EVENT LOOKUP. It is used to configure/indicate the next node to follow/execute after the selected node.
24.5.5 Continue
The Continue connection is only available on an EVENT LOOKUP node. It is used to configure/ indicate the next node to follow/execute after the selected node and any matched events are processed through the for Each Match connection.
24.5.6 for Each Match
The for Each Match connection is only available on an EVENT LOOKUP node. It is used to configure/indicate the node to follow/execute for each matched event.
24.5.7 Time Expired
The Time Expired connection is only available on a WAIT node. It is used to configure/indicate the node to follow/execute after the WAIT node has expired. In order for expiry to occur, the expiry time must be configured against the WAIT node. If no expiry time is configured for a WAIT node, its associated Time Expired connection will never be followed.
24.5.8 “branch”
The “branch” connection is only available on a WAIT node or an IF node. It is used to configure/ indicate the next node to follow/execute after the selected node for the selected node branch. A “branch” connection will only be followed if the condition defined against the associated node branch is met.
If there are multiple “branch” connections for a node, they are processed in order with execution following only the first node branch whose condition is met. If none of the node branch conditions are met, then none of the “branch” connection are followed/executed.
24.6 Policy Node Types
When you right-click within an empty part of the Policy Editor, another menu (the Add Node menu) appears that allows you to add new policy nodes. This menu contains these options:

Figure 24-10 Add Node Menu
- Add Node - Click this to display another menu with the following options:
- If - See IF Node.
- Wait - See WAIT Node.
- Event Lookup - See EVENT LOOKUP Node.
- Do - See DO > Action Nodes.
- Regex Variable
- Acknowledge Event
- Avaya CM Lookup
- New Event
- Math
- ComStruc Call
- Script Call
- Paste
You can configure the various policy node types by double-clicking on the node and selecting Edit from the menu. A dialog associated with the node appears where you can change field values and configurations. These are detailed in the sections that follow.
Each policy node type dialog contains three buttons:
- Reset is used to revert all changed configuration settings/values back to their current value.
- Update is used to save all changed configuration settings/values.
- Close is used to close the policy node type dialog.
24.6.1 START Node
A START node is the first node in a Cycle policy.
To open the Edit Start Node dialog, where you can edit the values discussed in this section:
- Right-click on an Start node and select Edit.

Figure 24-11 Edit Start Node
- Node Description - The node description. This appears in the node menu and allows you to provide specific context to the node.
- Cycle Frequency (seconds) - The number of sections between executions of the policy. The cycle frequency must be specified in whole seconds.
1.1.1 IF Node
An IF node is used to change the node execution flow through the policy, based on logical conditions. The logical conditions are configured on one or more branches, where the first branch whose condition evaluates to true is the branch that is followed to the next policy node.
To open the Edit If Node dialog, where you can edit the values discussed in this section:
- Right-click on an IF node and select Edit.
To add a new IF node:
- Right-click in the white space of the Policy Editor and select Add Node > IF.
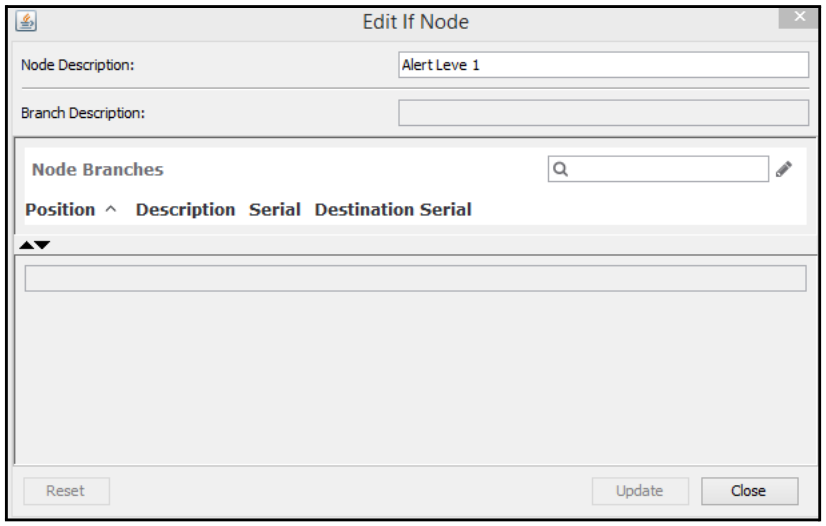
Figure 24-12 Edit If Node
- Node Description - The node description. Allows you to provide specific context to the node.
- Branch Description - The description of the selected branch in the Node Branches list.
- Node Branches - By default, no branches exist within an IF node. You must add one or more branches by right-clicking within an empty part of the Policy Editor and then selecting and configuring the node using the menu options.
- You can re-order node branches in the Node Branches list by moving individual branches up and down using the arrows within the dialog.
- You can edit node branches in this list by selecting the branch and clicking the Edit (pencil) icon in the dialog.
- You can also delete node branches in this list by right-clicking on a node branch in this dialog and selecting Delete.
- Boolean Tree Editor - This is used to build a graphical query.
- A condition variable can be either an event field name, a policy variable name, or a policy event variable/field name.
- A condition value can be either a static value, or when “Is Variable” is checked, a policy variable name, or a policy event variable/field name.
24.6.2 WAIT Node
A WAIT node is the default/first node of a WAIT policy. It can also be added as a node in either a Wait or Cycle policy.
To open the Edit Wait Node dialog, where you can edit the values discussed in this section:
- Right-click on a WAIT node and select Edit.
To add a new WAIT node:
- Right-click in the white space of the Policy Editor and select Add Node > WAIT.

Figure 24-13 Edit Wait Node
- Node Description - The node description. Allows you to provide specific context to the node.
- Seconds to wait before “Expire Branch” - The number of seconds to wait before expiration of the WAIT node and subsequent execution of Time Expired branch. The expiration time can be specified in whole or decimal seconds. When specifying a decimal value, the effective minimum expiration time is 20ms (or 0.02 seconds). The system will round any value less than 20ms up to 20ms.
- Policy Event Variable Name - The policy variable name for the matched event.
- Branch Description - The description of the branch selected in the Node Branches list.
- Node Branches - By default, a single branch exists with a default description of “Time Expired”. Uses can add one or more additional branches by right-clicking in the list and selecting the associated menu option.
- Any branch other than the default “Time Expired” branch should be configured with a query in the Boolean Tree Editor.
- You can re-order node branches in the Node Branches list by moving individual branches up and down using the arrows within the dialog.
- You can edit node branches in this list by selecting the branch and clicking the Edit (pencil) icon in the dialog.
- You can also delete node branches in this list by right-clicking on a node branch in this dialog and selecting Delete.
- Boolean Tree Editor - This is used to build a graphical query.
- A condition variable can be either an event field name, a policy variable name, or a policy event variable/field name.
- A condition value can be either a static value, or when “Is Variable” is checked, a policy variable name, or a policy event variable/field name.
24.6.3 EVENT LOOKUP Node
An EVENT LOOKUP node is used to lookup events in the event system.
To open the Edit Event Lookup Node dialog, where you can edit the values discussed in this section:
- Right-click on an EVENT LOOKUP node and select Edit.
To add a new EVENT LOOKUP node:
- Right-click in the white space of the Policy Editor and select Add Node > EVENT LOOKUP.

Figure 24-14 Edit Event Lookup Node
- Node Description - The node description. Allows you to provide specific context to the node.
- Policy Event Variable Name - The policy variable name for the matched event.
- Boolean Tree Editor - This is used to build a graphical query.
- A condition variable can be either an event field name.
- A condition value can be either a static value, or when “Is Variable” is checked, a policy variable name, or a policy event variable/field name.
24.6.4 DO > Action Nodes
This section introduces the various DO > Action nodes.
To open the Edit DO > Action Node dialog, where you can edit the values discussed in this section:
- Right-click on a DO > Action node and select Edit.
To add a new DO > Action node:
- Right-click in the white space of the Policy Editor and select Add Node > DO > Action.
Regex Variable
A DO > Regex Variable node is used to perform a pattern match against a specified policy variable value using a specified regular expression. It also stores the first capturing group match results in a specified policy variable.
In the Edit Regex Variable dialog, you can edit the following values:
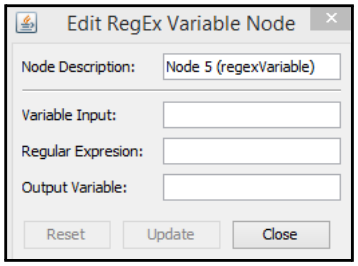
Figure 24-15 Edit RegEx Variable
- Node Description - The node description. Allows you to provide specific context to the node.
- Variable Input - The policy variable name whose value is to be used as input.
- Regular Expression - A regular expression (see java.util.regex.Pattern) to use for pattern matches against the Variable Input value. The regular expression should be at least one capturing group.
- Output Variable - The policy variable name in which to store the match result for the first capturing group from the regular expression.
Acknowledge Event
A DO > Acknowledge Event node is used to acknowledge an event previously matched via the WAIT or EVENT LOOKUP nodes.
In the Edit Acknowledge Event Variable dialog, you can edit the following values:

Figure 24-16 Edit Acknowledge Event
- Node Description - The node description. Allows you to provide specific context to the node.
- Acknowledge Event Name - The policy variable name for previously the previously matched event to acknowledge. This should be the value from the Policy Event Variable Name configuration for a WAIT or EVENT LOOKUP node.
Avaya CM Lookup
A DO > Avaya CM Lookup node is used to execute the Avaya CM “doQuery’ comstruc against a specified Avaya CM function and a specified policy variable value, and store the results in a specified policy variable.
In the Edit CM Lookup dialog, you can edit the following values:
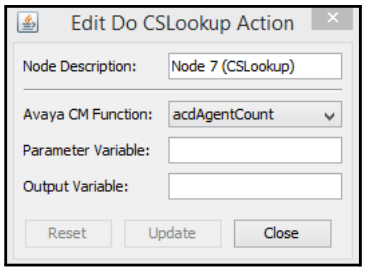
Figure 24-17 Edit CM Lookup
- Node Description - The node description. Allows you to provide specific context to the node.
- Avaya CM Function - The Avaya CM “doQuery” comstruc function.
- Parameter Variable - The policy variable name whose value is to be used as input.
- Output Variable - the policy name in which to store the Avaya CM “doQuery” construc result for the specific Avaya CM function and Policy Parameter Variable value.
New Event
A DO > New Event node is used to generate and add a new event in the event system.
In the Edit New Event dialog, you can edit the following values:

Figure 24-18 Edit New Event
- Node Description - The node description. Allows you to provide specific context to the node.
- Event Field Name - The name of the selected event field. This is not an editable field. It reflects the field whose value is being used through the Event Field Value.
- Event Field Value - The value of the selected event field in the New Event Fields list.
- New Event Fields list - The New Event Fields list contains all available event fields. By default, there are not values assigned to any of them. To modify the value for a specific field, select the corresponding row in the list. The use the Event Field value above to modify the value.
Math
A DO > Math node is used to perform a simple mathematic operation using two values as input and store the result in a specified policy variable. Each input value can be either a user- entered value or a specified policy variable whose value is to be used as the input.
In the Edit Do Math dialog, you can edit the following values:
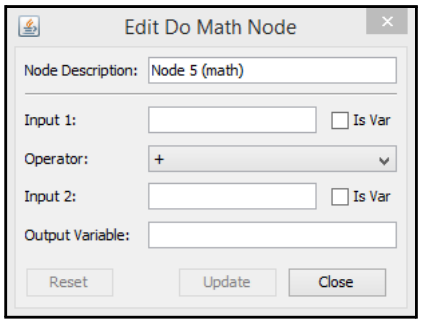
Figure 24-19 Edit Do Math
- Node Description - The node description. Allows you to provide specific context to the node.
- Input 1 - The first input value (or if IsVar is selected, a policy variable name or policy event variable field name whose value will be used).
- Operator - The operator representing the function to perform:
- + (addition)
- - (subtraction)
- *** (multiplication)**
- / (division)
- % (modulus)
- Input 2 - The second input value (or if IsVar is selected, a policy variable name or policy event variable field name whose value will be used).
- Output Variable - The policy variable name in which to store the operation result.
ComStruc Call
A DO > ComStruc Call node is used to execute a specified ComStruc and store the results in a specified policy variable.
In the Edit ComStruc Call dialog, you can edit the following values:
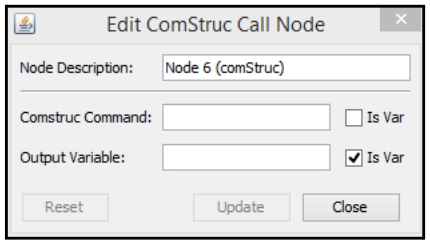
Figure 24-20 Edit ComStruc Call
- Node Description - The node description. Allows you to provide specific context to the node.
- ComStruc Command - The ComStruc to execute. Only ComStrucs that accept direct parameters are supported:
- Parameters to the ComStrucs must be enclosed in curly braces; for example, “{aValue}”.
- Policy variable names or policy event variable/field names can be specified by enclosing the policy variable name in square brackets; for example, “{[aPolicyVariable]}”.
- Greater than/less than characters are also supported; for example, “{<aPolicyVariable>}”. It is not a requirement to select the IsVar check box.
- Output Variable - The policy variable name in which to store the ComStruc result.
Note: You must select the IsVar check box to properly specify the Output Variable name.
Script Call
A DO > Script Call node is a specialized node used to call a Groovy script.
In the Edit Script Call dialog, you can edit the following values:

Figure 24-21 Edit Script Call
- Node Description - The node description. Allows you to provide specific context to the node.
- Field Name - The name of the selected field. This is not an editable field. It simply reflects the field whose value is being set through the Field Value.
- Field Value - The event field value can be either a static value (or if IsVar is selected, a policy variable name or policy event variable field name whose value will be used).
- Script Call Fields list - This is a list of fields that are specific to a script call.
-
To modify the value for a specific field, select the corresponding row in the list and use the event Field Value above to modify the value.
-
Three fields exist by default and cannot be removed:
scriptName – Specifies the name of the Groovy script to be called. This can be a simple file name or relative path/file name. The file or path/file should exist in the
/scriptsdirectory for the installation on the server.arguments – This should be zero or more values to be passed within the “args” binding to the Groovy script. This is a string of command-line parameters and can be left blank. When specifying multiple values, they should be separated by spaces. If an individual value contains spaces, it should be enclosed in double-quotes. Policy variables and policy event variable name/events can be included by enclosing the name in “<>” or “[]”; for example, “[aPolicyVariable]”.
outputVariable – This is the name of a policy variable to contain the result (such as the exit code) from the Groovy script. It is not necessary to select IsVar Var for the outputVariable value.
-
You can also create and pass specific bindings to the Groovy script by right-clicking on the Script Call Fields list and selecting Add to add a new named binding to pass into the Groovy script or selecting Remove to remove a named binding. Within the Groovy script, these named bindings should be directly accessible by name.
-
Note: You cannot remove the three default script call fields.
Note: Be careful with named bindings. Without proper error checking in the Groovy script, trying to access a named binding that does not exist can cause the Groovy script to fail and might require restarting the server instance.
24.7 Policy Variables
Within a policy, the following variables exist:
- Internal Variables
- User-Defined Variables
Within a policy, internal and user-defined variables exist.
In general, policy variable values can be:
- Entered directly as a Variable Name value for a condition on a WAIT or IF policy node.
- Entered directly as a value for any other policy node that accepts a variable name. For this variable, select the IsVar and Is Variable check boxes (if available) to denote that this is a variable.
- Specified by enclosing the it in “<>” or “[]”; for example, when used in a ComStruc Call node. Example: “[aPolicyVariable]”.
There is no means to display a policy’s variables and their values from the client’s policy configuration.
Instead, to view the policy variables and their values:
- Navigate to Reports > Tables.
- Select the POLICY module and VARIABLES table.
24.7.1 Internal Variables
When any policy node is evaluated, the current time (in milliseconds) is stored in the currentTime policy variable. In other words, the currentTime policy variable value is always the time in milliseconds when the processing for a specific node began.
Also, the [time] variable value represents the actual time at the moment of evaluation. It is simply specified as [time]. For this variable, select the IsVar and Is Variable check boxes (if available) to denote that this is a variable.
For an EVENT LOOKUP node, the numberOfEvents variable contains the number of matched events for the current/last evaluation for the EVENT LOOKUP node. For more information on this node, see EVENT LOOKUP Node.
24.7.2 User-Defined Variables
User-defined variables are specified through the policy node configuration.
An event identified/matched through the WAIT or EVENT LOOKUP nodes results in multiple actual variables, each denoted by an Event Name and Event Field. For more information on these nodes, see EVENT LOOKUP Node and WAIT Node.
The event name is specified in the WAIT or EVENT LOOKUP node configuration as “Policy Event Variable Name”. If an event is named myEvent, there will be multiple variables in the form of:
myEvent.<field>
where <field> is the name of an actual event field.
For example:
myEvent.deviceName, myEvent.eventId, and so on
Single variables are specified as policy node configuration Output Variable values.
Creation of variables may require at least one initial execution of a policy, but after the variables are created, the can be accessed as described previously.
24.8 Boolean Tree Editor
The Boolean Tree Editor appears on the WAIT, IF, and EVENT LOOKUP policy node types. It is also used by various other components through the client.
The following is an example of a Boolean Tree Editor in the Edit Event Lookup Node dialog:
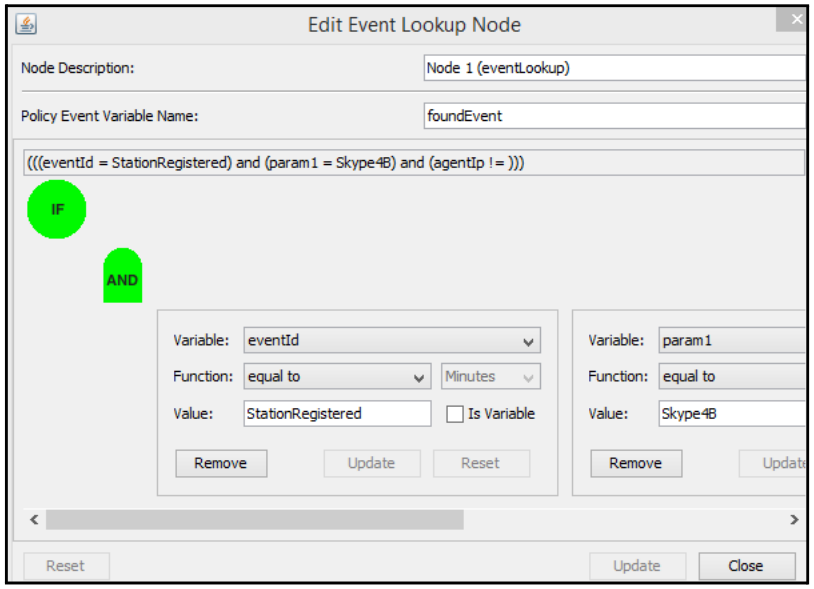
Figure 24-22 Example: Boolean Tree Editor
The Boolean Tree Editor is used to build a logical expression using the following Boolean Tree Editor nodes:
- IF – The default/first node at top of Boolean Tree Editor logical expression.
- AND – Used to perform a logical AND of the AND node’s subtending nodes.
- OR – Used to perform a logical OR of the OR node’s subtending nodes.
- NOT – Used to perform a logical negation of the NOT node’s subtending nodes.
- XOR – Used to perform a logical exclusive OR of the XOR node’s subtending nodes.
- Condition – A condition in which an operation is specified against a variable and a value. The result of this is used in the larger logical expression that contains it.
A Condition appears as a sub-pane on the Boolean Tree Editor, with components used to directly manipulate the condition. The components available on a Condition are:
-
Variable – Used to specify the variable whose value is used when evaluating the condition, compared against the value represented in the Value field.
In most instances, this is a read-only component in which a user can select from a list of values. However, in some cases, it is editable (for example, in a WAIT or IF policy node) where a policy variable name can be specified.
-
Function – Used to specify the function/operation used with the Condition. Available functions include:
-
equal to – Perform a string comparison to determine if values are equal.
-
not equal to – Perform a string comparison to determine if values are not equal.
-
contains – Perform a string lookup to determine if variable value contains string value.
-
greater than – Perform an arithmetic comparison to determine if variable value is greater than value.
-
less than – Perform an arithmetic comparison to determine if variable value is less than value.
-
greater than or equal to – Perform an arithmetic comparison to determine if variable value is greater than or equal to value.
-
less than or equal to – Perform an arithmetic comparison to determine if variable value is less than or equal to value.
-
within last – Using the Variable value and the specified value as times, determine if the variable value time is within the specific time value with respect to the current time when the expression is evaluated.
For example, selecting “seconds” for Time Units and specifying a value of “5” for Value, the expression evaluates to true if the Variable value (evaluated as a time) is within 5 seconds of the current time when the expression is evaluated.
-
-
For a policy node, an additional Time Units field appears. It is used with the within last operation.
-
Value – Used to specify a static value to use when evaluating the condition, or for the WAIT, IF, or EVENT LOOKUP policy nodes. If is Variable is checked, this is used to specify a policy variable or policy event variable name (the value of which will be used when evaluating the Condition).
The Boolean Tree Editor provides a graphical interface to build the logical expression. The expression is built using pop-up menu options on the IF, AND, OR, NOT, and XOR nodes. These nodes are used to add additional nodes to the expression. As the expression is built, nodes and conditions are added to individual nodes. This means that the AND, OR, NOT, or XOR node is added first, then additional nodes or conditions are added to the corresponding expression node.
For example, follow the procedure below to build a logical expression in which:
- Two conditions are evaluated
- The results are AND’ed together
- Right-click the initial IF node, and select Add AND.
- Right-click the new AND node, and select Condition to add a single condition to the AND node.
- Right-click the AND node again, and select Condition to add a second condition to the AND node.
- Modify the individual conditions to reflect the desired conditional expressions.